
Figures & data
Table 1. The feed composition of pre-laying period.
Table 2. The feed composition of early period.
Table 3. The feed composition of peak period.
Table 4. The feed composition of middle to later period.
Table 5. The total bile acids concentration at various laying stages.
Table 6. The specific bile acids concentration at various laying stages.
Figure 1. The effect of taurine-conjugated lithocholic acid on fat deposition in LMH cell. (A) Oil Red O staining (B) Quantification of Oil Red O. Data are represented as mean ± SEM, n = 4. LMH refers to a primary hepatocellular carcinoma epithelial cell line established in 1981 by Tomoyuki Kitagawa at the Cancer Institute, Kami-Ikebukuro, Toshima-ku, Tokyo, Japan.
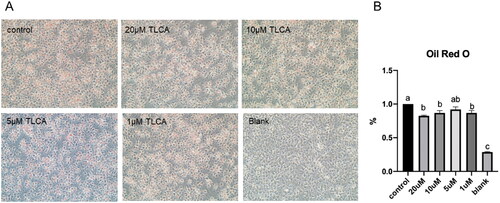
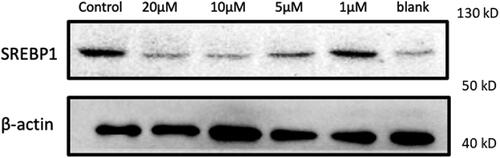
Figure 2. The effect of taurine-conjugated lithocholic acid on protein expression of SREBP1. n = 3.
Data availability statement
The data presented in this study are available on request from the corresponding author.