
Figures & data
Table 1. Growth performance of Muscovy ducks fed diets containing 0% (HI0), 3% (HI3), 6% (HI6) or 9% (HI9) of partially defatted black soldier larvae meal substituted for maize gluten meal (from Gariglio et al. Citation2021).
Figure 1. Box plots of the alpha diversity indexes in caecal samples of Muscovy ducks fed diets containing 0% (HI0), 3% (HI3), 6% (HI6) or 9% (HI9) of partially defatted black soldier larvae meal substituted for maize gluten meal. Treatments without a common letter are statistically different by the Dwass-Steel-Critchlow-Fligner test for multiple comparisons at p < 0.05.
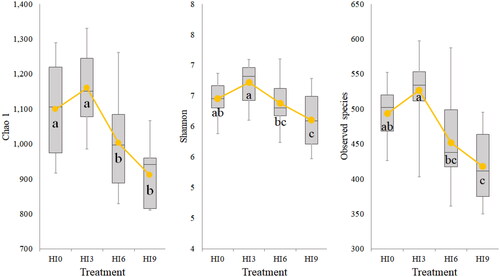
Figure 2. Relative abundance of bacterial phyla in caecal samples of Muscovy ducks fed diets containing 0% (HI0), 3% (HI3), 6% (HI6) or 9% (HI9) of partially defatted black soldier larvae meal substituted for maize gluten meal.
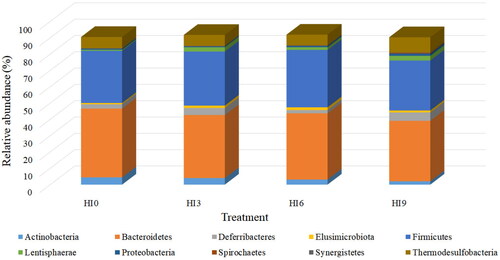
Figure 3. Relative abundance of bacterial genera in caecal samples of Muscovy ducks fed diets containing 0% (HI0), 3% (HI3), 6% (HI6) or 9% (HI9) of partially defatted black soldier larvae meal substituted for maize gluten meal. U.: unclassified.
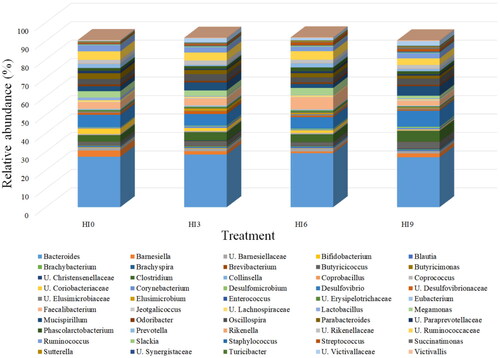
Figure 4. Canonical discriminant plot. Observations correspond to caecal samples of Muscovy ducks fed diets containing 0% (HI0; orange dots), 3% (HI3; red dots), 6% (HI6; green dots) or 9% (HI9; blue dots) of partially defatted black soldier larvae meal substituted for maize gluten meal. Class means of each treatment are indicated by squares of the corresponding colour. The black lines indicate the contribution of each predictor to the separation of the groups in the discriminant functions (×3 rescaling for the sake of readability). DF: discriminant function (within parentheses proportion of total variance explained). U.: unclassified.
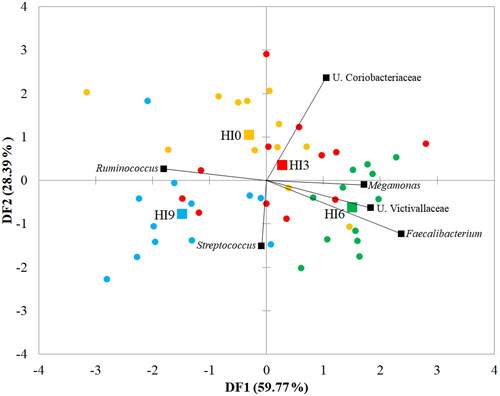
Table 2. Canonical discriminant analysis results.
Table 3. Effects of diets containing 0% (HI0), 3% (HI3), 6% (HI6) or 9% (HI9) of partially defatted black soldier larvae meal substituted for maize gluten meal on the caecal volatile compounds of Muscovy ducks.
Data availability statement
The data that support the findings of this study are available from the corresponding author, [M. G.], upon reasonable request.