
Figures & data
Table 1. Physicochemical traits of the Longissimus thoracis et lumborum of pig fatteners.
Table 2. List of primers for genotyping, methylation and qRT-PCR.
Table 3. Genotype and allele frequencies of IFI6 gene.
Table 4. Least square means (LSM) and standard errors (SE) for meat quality traits across genotype of IFI6 gene.
Figure 1. Methylation sites in the promoter region of IFI6 gene. The IFI6 promoter region was predicted for the CpG island by using the MethPrimer program. There are four CpG islands identified in the IFI6 gene.
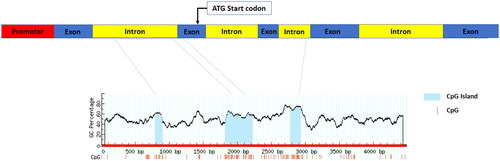
Figure 2. Methylation percentage of the CpG islands in the promoter of IFI6 gene. The methylation percentages were determined by pyrosequencing between low and high meat pH groups. The bars represent the mean ± SE. * indicates the difference of promoter methylation percentage was statistically significant (p < 0.05) between groups.
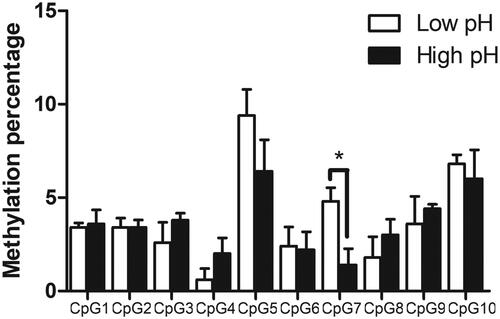
Figure 3. Expression level of IFI6 gene between divergent phenotypic groups. qRT-PCR analysis of IFI6 gene expression from (a) low pH24h vs high pH24h and (b) low vs high drip loss groups (n = 5 per group) in pigs. GAPDH (Glyceraldehyde-3-Phosphate Dehydrogenase) was used as a reference gene for the normalisation of transcripts. The bars represent the mean ± SE. *p < 0.05 and **p < 0.01 denote statistically significant difference.
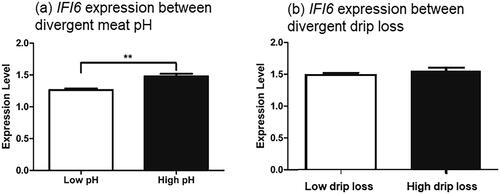
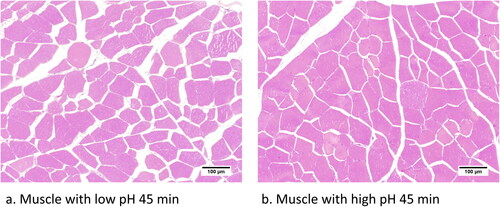
Figure 4. Histological features of muscle from divergent phenotypic groups. The samples were collected at approx. 45 min after carcase bleeding or post-mortem, formalin fixed, stained with H&E, and studied under microscope (10×).
Data availability statement
The data presented in this study are available on request from the corresponding author upon reasonable request.