
Figures & data
Figure 1. System boundaries for the pig whole production cycle (breeding plus fattening phases).
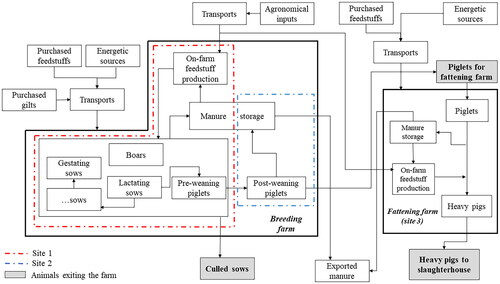
Table 1. Descriptive statistics of farm management and animal performance for sows and piglets < 7.5 kg body weight (Site1, 8 farms).
Table 2. Descriptive statistics of feed consumption (as fed) and diet characteristics (% as fed) for sows and piglets < 7.5 kg body weight (Site1, 8 farms).
Table 3. Descriptive statistics of farm, diet management, and performance for post-weaning piglets (7.5–30 kg body weight) (Site2, 8 farms).
Table 4. Descriptive statistics of farm and diet management and of animal performance for fattening pigs (Site3, 10 farms).
Table 5. Farm variables used as fixed effects in the permanova analysis of the impact category values associated with pig breeding farms (sows plus piglets <7.5 kg body weight – Site1, post-weaning piglets (7.5–30 kg body weight) – Site2) and fattening pig farms (Site3).
Table 6. Results of PERMANOVA (F-value, p-value and root square mean error – RMSE) for the impact category values, referred to 1 kg body weight gain, associated with the pig breeding farms (site 1: sow and gilt management plus piglets from birth to weaning).
Table 7. Results of PERMANOVA (F-value, p-value and root square mean error – RMSE) for the impact category values, referred to 1 kg body weight gain, associated with the pig breeding farms (site 2: piglets from weaning to sale).
Table 8. Results of PERMANOVA (F-value, p-value and root square mean error – RMSE) for the impact category values, referred to 1 kg body weight gain, associated with the pig fattening farms (site 3).
Figure 2. Raw means, standard deviations and hotspot analysis (%) of impact categories, per 1 kg body weight gain, associated with piglets sold by the breeding farms (site 1 + site 2, n = 8).
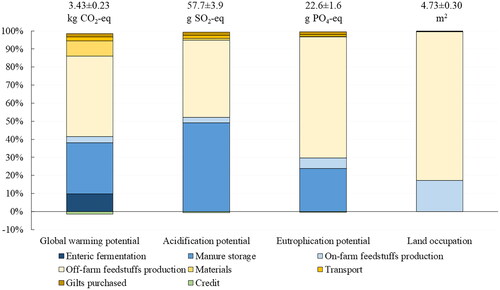
Figure 3. Raw means, standard deviations and hotspot analysis (%) of impact categories, per 1 kg body weight gain, associated with heavy pigs production (during the growing-fattening period) (site 3, n = 10).
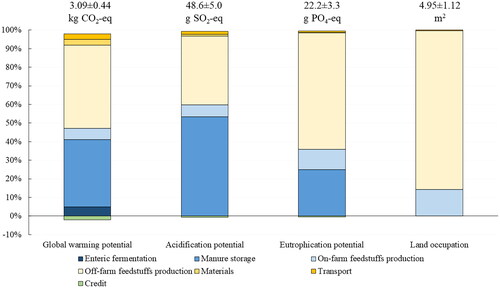
Figure 4. Raw means, standard deviations and hotspot analysis (%) of impact categories, per 1 kg body weight gain (BWG), associated with the heavy pig production in 18 farms (whole life cycle, from birth to sale at 170 kg BW).
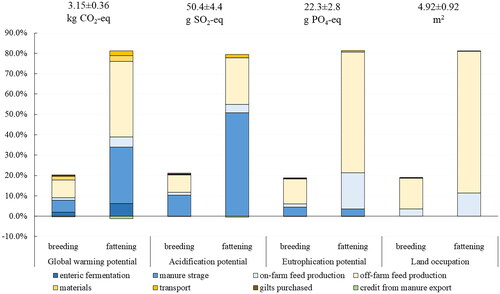
Figure 5. Least square means (LSmeans) of the impact categories (GWP: global warming potential, kg CO2-eq, AP: acidification potential, g SO2-eq, EP: eutrophication potential, g PO4-eq, LO: land occupation, m2), referred to 1 kg body weight (BW) gain, for the farm traits affecting the impact categories with p < .1 in Site1 (sows plus piglet <7.5 kg BW) and Site2 (piglets 7.5–30 kg BW). The farms were classified in two classes on the basis of the average value of each variable of farm management, feeding practice or animal response. LSmeans for low- and high-class farms with different superscripts within row differ significantly (a,b: p < .10; A, B: p < .05).
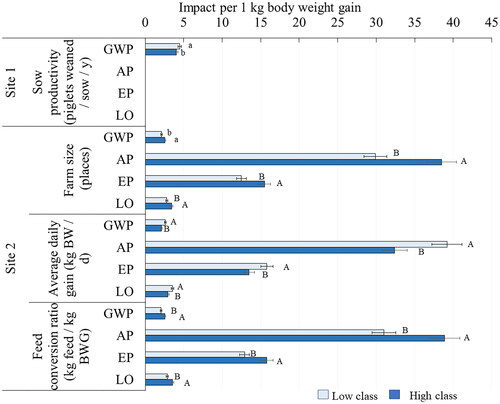
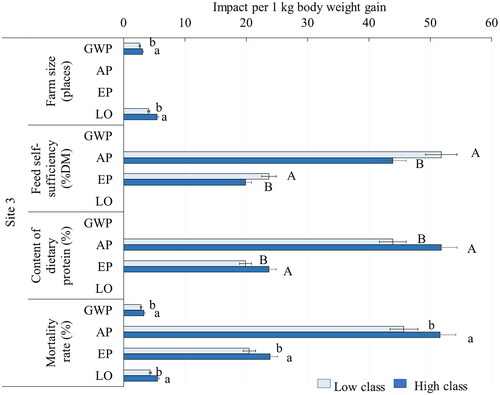
Figure 6. Least square means (LSmeans) of the impact categories (GWP: global warming potential, kg CO2-eq, AP: acidification potential, g SO2-eq, EP: eutrophication potential, g PO4-eq, LO: land occupation, m2), referred to 1 kg body weight (BW) gain, for the farm traits affecting the impact categories with p < .1, in the Site3 (fattening pigs 30–170 kg BW). The farms were classified in two classes on the basis of the average value of each variable of farm management, feeding practice or animal response. LSmeans for low- and high-class farms. LSmeans for low- and high-class farms with different superscripts within row differ significantly (a,b: p < .10; A, B: p < .05).
Supplemental Material
Download MS Word (68.6 KB)Data availability statement
The data presented in this study are available on request from the corresponding author upon reasonable request.