
Figures & data
Table 1. Diet composition and its nutritional values given to experimental birds.
Table 2. Gene primer sequences for quantitative RT-PCR.
Table 3. Feed consumption and growth performance of crossbreed after seven-day heat stress (HS).
Figure 1. Histological effect induced by heat stress (HS) on the liver and spleen of crossbreed. Magnification was 20×, and scale denotes 50 μm. Control groups illustrate WP (white pulp), RP (red pulp) and CA (central artery) in spleen (a1) and the central vein (CV), sinusoidal cells (S) and hepatocytes in liver (b1). Panels a2–a4 and b2–b4 are HS groups of spleen and liver tissues, respectively. For histological comparison, different shapes were used to depict the pathological changes. Spleen (a2–a4): (
 ) represents mild vacuole degeneration, (
 ) shows red blood cell hyperplasia, (
 ) shows degeneration of red and white pulp. Liver (b2–b4): b2 depicts tissue inflammation with mononuclear cell infiltration (
 ) and vacuolar degeneration (
 ); b3 shows dilated CV with mild hyperplasia (
 ), tissue haemorrhages with necrosis (
 ) and mild inflammatory cells infiltration (
 ); b4 shows dilation in portal area with red blood cells hyperplasia (
 ), mononuclear cell infiltration (
 ) and vacuolar degeneration (
 ).
).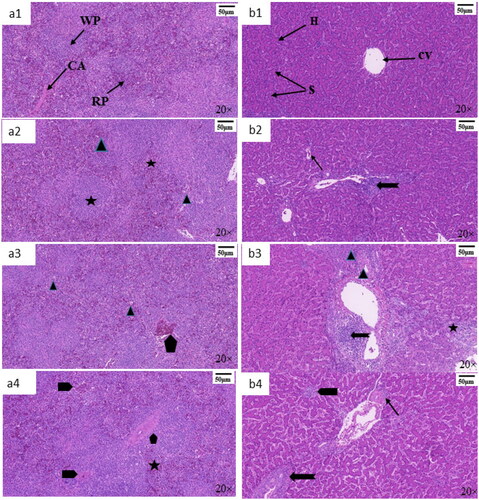
Figure 2. Relative mRNA expression levels of somatotropic genes related to muscle growth and heat shock proteins in liver and pectoralis major muscle tissues isolated after seven days of heat stress (HS). X-axis represents the treatments (HS or CN) and respective genes, while Y-axis shows the relative mRNA expression level. Relative mRNA expression of growth hormone receptor (GHR), insulin growth factor-1 (IGF-1) and its receptor (IGF-1R) in liver (a) and pectoral muscles (b). Relative mRNA expression of HSP70 and HSP90 in liver (c), pectoral muscle (d) and hypothalamus (e). Significant difference at (p < .01) is shown with **, while * depicts significant difference of p < .05. CN and HS represent control group and heat stress group, respectively.
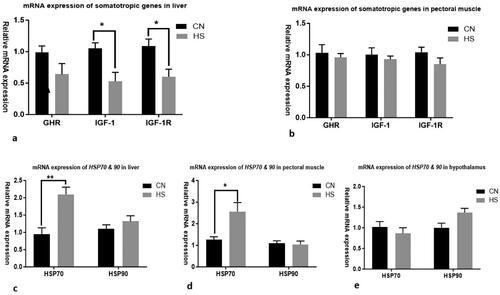
Figure 3. Effect of heat stress (HS) on antioxidant and immune status of crossbreed chicken. Relative mRNA expression levels of superoxide dismutase (SOD) and catalase (CAT) in liver (a) and in pectoral muscle (b). Relative mRNA expression levels of IL-4, IL-6 (c), IL-10 and IL-1β (d) in hepatic tissues. *Significant difference at p < .05. CN and HS represent control group and heat stress group, respectively.
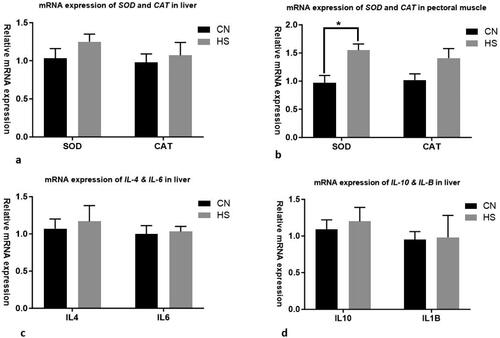
Table 4. Effect of heat stress on meat colour parameters after seven days of heat stress.
Table 5. Effect of heat stress on drip loss, cook loss, water holding capacity, and shear force of pectoral and thigh muscle after seven days of heat stress.
Supplemental Material
Download MS Word (74.4 KB)Data availability statement
No new data were created in this study.