
Figures & data
Table 1. Muscle physical and texture parameters of grass carp after 120-days feeding experiment.
Table 2. Summary statistics of transcriptome sequencing from muscle tissue between ordinary grass carp and the crisp carp group.
Figure 1. Volcano map and heat map of clustering of differentially expressed genes in Ctenopharyngodon idellus.
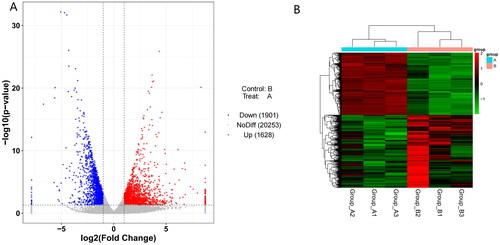
Figure 2. Classify and analysis according to gene function. (A) GO enrichment of top 20 up-regulated and down-regulated DEGs. (B) KEGG enrichment of top 20 up-regulated and down-regulated DEGs.
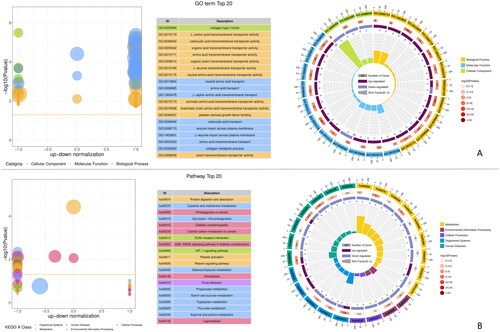
Table 3. Differentially expressed genes (DEGs) identified in the muscle tissue between ordinary grass carp and the crisp carp group (Top20).
Figure 3. (A) GO enrichment of DEGs. (B) GO enrichment of up-regulated DEGs. (C) GO enrichment of down-regulated DEGs.
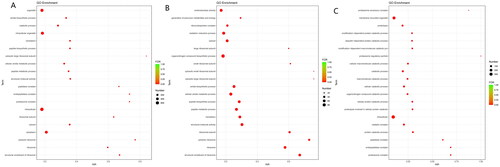
Figure 4. (A) KEGG pathway enrichment of DEGs. (B) KEGG pathway enrichment of up-regulated DEGs. (C) KEGG pathway enrichment of down-regulated DEGs.
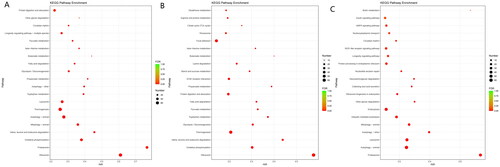
Figure 5. PPI network construction and hub gene screening.
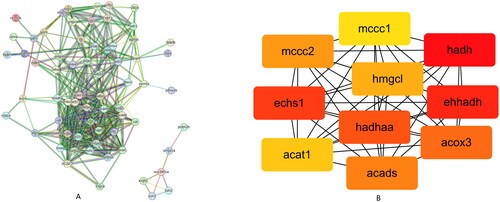
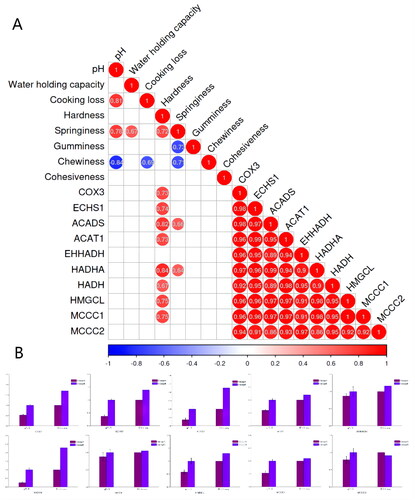
Figure 6. (A) Correlation analysis between the top 10 hub genes and meat quality. (B) Comparison between RNA-Seq result and qRT-PCR validation result. The y-axis is the relative fold change. Data are presented as mean ± SEM.
Supplemental Material
Download MS Excel (7.7 MB)Data availability statement
The data that support the fundings of this study are available from the corresponding author upon reasonable request.