
Figures & data
Table 1. Analytical methods for feed additives established by EU regulation, ISO, CEN (EN standards) and used by the laboratories participating in the proficiency tests included in this publication. Reversed phase high performance liquid chromatography: RP-HPLC. UV: Ultraviolet. MS: single quadrupole mass spectrometry. MS/MS: tandem mass spectrometry. +: the EN standards are also included in Commission Implementing Regulation (EU) Citation2024/771.
Table 2. Details of the proficiency tests (PTs) and corresponding feed additives included in the four case studies. In all cases, the test material was compound feed containing the feed additives. For PTs with several analytes the number of laboratories reporting results differed amongst these analytes. RP-HPLC: Reversed-phase high performance liquid chromatography. NP: Normal phase. UV: Ultraviolet detection. There the following four methods for establishing the assigned values of the PTs. Method A: by formulation based on spiking blank compound feed with solutions containing known amount of the target analytes. Method B: by formulation based on spiking blank compound feed with solid feed additive preparations containing known amount of the target analytes. Method C: by calculating the mean value from measurements conducted by expert laboratories that did not participate in the PTs. Method D: by calculating the robust mean of the results from a Sub-group of laboratories participating in the PTs and applying an official analytical method.
Figure 1. Measurement capability of laboratories assessed by proficiency tests (PTs) expressed as relative differences (EquationEq. 2(2),
(2), ): first, the robust means of the analytical results submitted by the laboratories were calculated individually for each analyte. Subsequently, these values were compared with the corresponding assigned values established by formulation (coccidiostats and vitamin D3) or by reference values set by external expert laboratories (trace elements) according to EquationEq. (2)
(2),
(2), . The green line for the two trace elements shows the mean value of the corresponding relative differences calculated for cobalt and selenium, respectively.
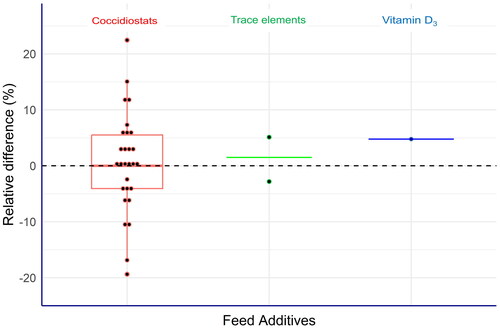
Table 3. Conditions for mixing canthaxanthin produced by chemical synthesis (identification number 2a161g) into compound feed. Given the known instability of carotenoids, this feed additive is exclusively added via preparations.
Figure 2. Relation between the relative standard deviation (RSD) of the number of particles and the corresponding particle size. First, the number of particles were calculated separately for each particle size using the information from Table . Subsequently, the RSD was determined from the poisson distribution for the different particle numbers. Given the acceptable RSD of about 3%, the target particle size should be between 150 and 250 µm.
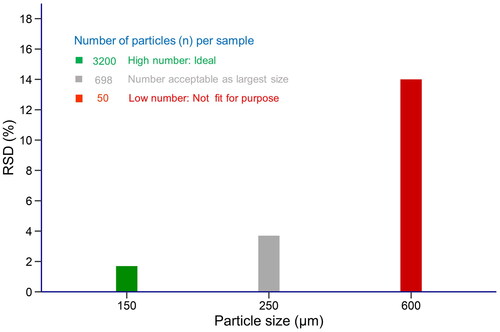
Figure 3. Box plots of the relative differences between the laboratories’ results and the labelled content of vitamin A in the commercial compound feed used as test material (EquationEq. 4(4),
(4), ). All laboratories of the 2022 PT exercise reported values clearly below the labelled values, while these differences were much less in the 2016 PT. This also applied to the assigned values in the PT exercise.
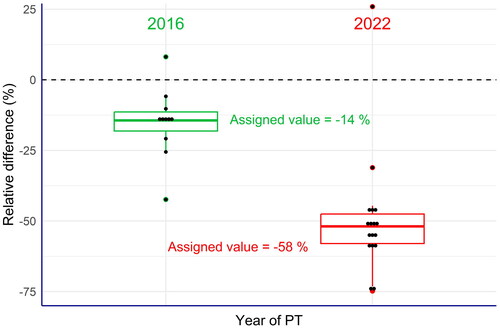
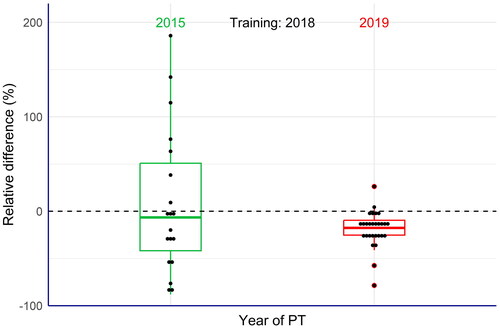
Figure 4. Box plots of the relative differences between the laboratories’ results and the assigned value of three carotenoids (canthaxanthin, astaxanthin and adonirubin) in the commercial compound feeds used as test materials (EquationEq. 5(5)
(5) ). Large deviations of the results from the assigned values were observed in the proficiency tests (PTs) from 2015. After a training exercise organised by the EURL-FA for the laboratories concerned, the results of a PT from 2019 showed significant less variations, thus confirming overall improvement of the laboratories’ performance.
Data availability statement
The data presented in this article are freely available from cited published articles.