
Figures & data
Table 1. Percentiles of EMY (mature equivalent milk yield) and eECM (mature equivalent energy corrected milk) used to allocate the buffaloes to the four classes of productive levels.
Table 2. Descriptive statistic of the buffaloes (n = 68) enrolled in the trial, and quality and quantity parameters of milk. Data are means ± SE.
Table 3. Descriptive statistic of cortisol concentrations of the four matrices.
Figure 1. Cortisol concentrations (pg/mL) of 68 milk samples according to parity and stage of lactation.
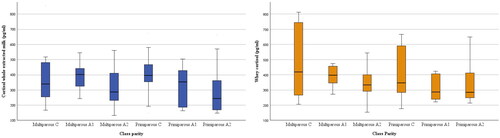
Figure 2. Comparison between whey and whole extracted milk cortisol concentrations (pg/mL).
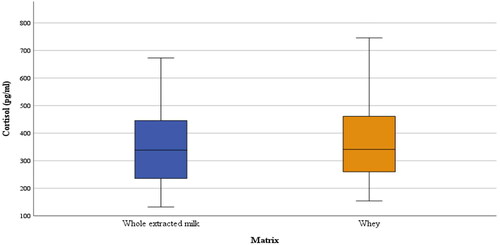
Figure 3. Cortisol concentrations in hair (pg/mg) and plasma (ng/mL) according to parity and stage of lactation.
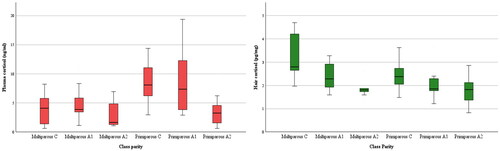
Figure 4. Cortisol concentrations of whole extracted milk (pg/mL), whey (pg/mL), plasma (ng/ml) and hair (pg/mg) sorted by productive classes (1–4).
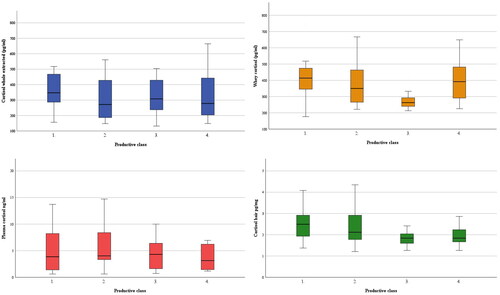
Table 4. Correlations between the cortisol concentrations of the four matrices and the mature equivalent milk parameters (mature equivalent milk yield, EMY; mature equivalent fat content, EFC; mature equivalent protein content, EPC; mature equivalent energy corrected milk, eECM).
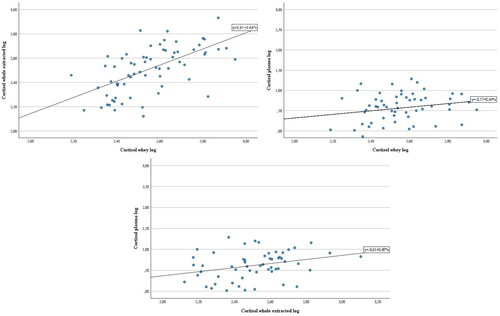
Figure 5. Cortisol concentrations of whole extracted milk (pg/mL) (left panel) and plasma (ng/mL) (right panel) regressed on whey (pg/mL) and of plasma (ng/mL) regressed on whole extracted milk (below panel) (pg/mL) in a linear model. The whole extracted milk, whey and plasma cortisol concentrations were log-transformed and included as independent and dependent variables, respectively.
Data availability statement
The data that support the findings of this study are available from the corresponding author, upon reasonable request.