
Figures & data
Figure 1. Number of runs of homozygosity (ROH) and average length in Mb across the 31 horse autosomes.
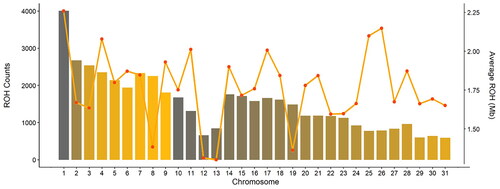
Table 1. Inbreeding divided based on runs of homozygosity (ROH) length classes to differentiate ancient and recent inbreeding.
Figure 2. Violin plots showing inbreeding based on runs of homozygosity (ROH) across the 31 horse autosomes.
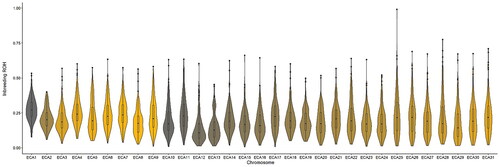
Figure 3. Correlation between inbreeding based on genotype and pedigree data.
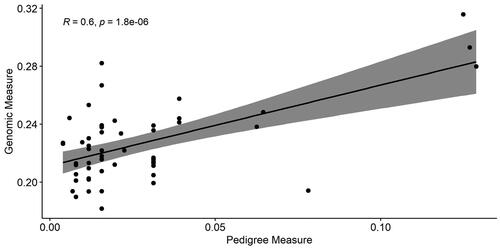
Figure 4. Runs of homozygosity (ROH) islands on ECA1, ECA5, ECA7 and ECA17 in the Anglo Arabian (AA) horse breed. The x-axis represents the chromosome position in Mb and the y-axis represents the number of horses showing an ROH in each chromosome position. A dotted line shows significance level which was set as over 70% of the horses showing a ROH in a specific position.
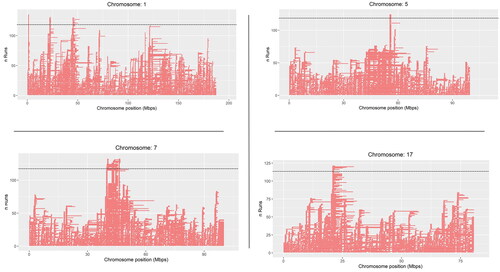
Table 2. Runs of homozygosity (ROH) islands shared in over 70% of the Anglo Arabian (AA) horses, with genomic coordinates and a list of known QTLs located within each ROH island.
Figure 5. Effective population size (Ne) based on linkage disequilibrium (LD) in a 20 generations time-period in the Anglo Arabian (AA) breed.
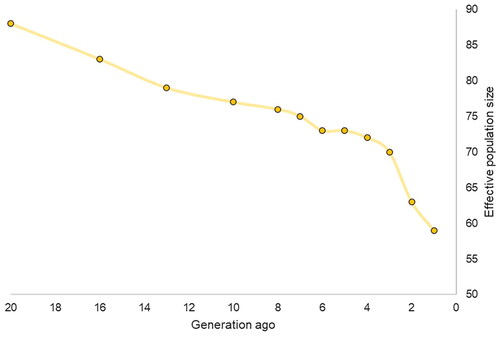
Figure 6. Principal Component analysis and breeds differentiation. AA means Anglo Arabian horses, ARR Arabian and TB thoroughbred.
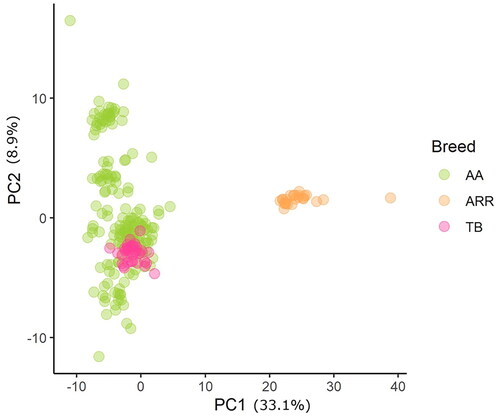
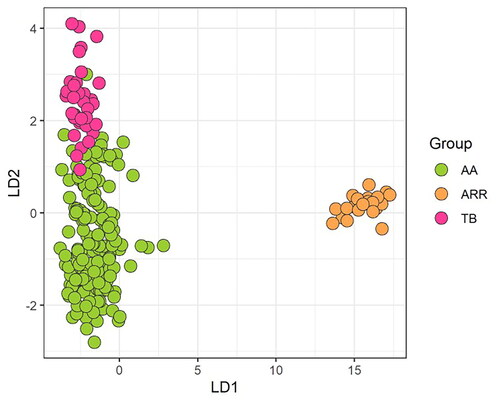
Figure 7. Discriminant Analysis of Principal Components plot of linear discriminant function 1 (LD1) and linear discriminant function 2 (LD2). AA means Anglo Arabian horses, ARR Arabian and TB thoroughbred.
Supplemental Material
Download MS Word (61.2 KB)Data availability statement
The data that support the findings of this study are available from the corresponding author, [author initials], upon reasonable request.