
Figures & data
Table 1. Composition and calculated analysis (% as fed) of the diet for laying hens.
Table 2. Characteristics and performance data of the primers used for qPCR analysis.
Table 3. Effects of specific sound frequency on the production performance of laying.
Table 4. Effects of specific sound frequency on the egg quality of laying hens.
Table 5. Effects of specific sound frequency on blood biochemistry of laying hens.
Figure 1. The effects of specific sound frequency on the mRNA expression levels of antioxidant-regulated genes in laying hens were investigated. The mRNA expression levels of NF-κB (A), iNOS (B), TNF-α (C), Occludin (D) and ZO-1 (E) were examined and exhibited. a–cMeans within the same row with different letters are significantly different (p < .05).
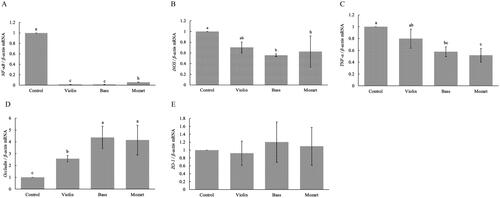
Table 6. Effects of specific sound frequency on jejunum–ileum’s and serum’s antioxidant activity of laying hens.
Table 7. Effects of specific sound frequency on jejunum–ileum’s immunity of laying hens.
Table 8. Effects of specific sound frequency on jejunum–ileum’s transcription factors of laying hens.
Figure 2. The jejunum–ileum intestinal morphology of laying hens were examined, with presentations of the control group (A), Violin group (B), Bass group (C) and Mozart group (D) jejunum–ileum intestines.
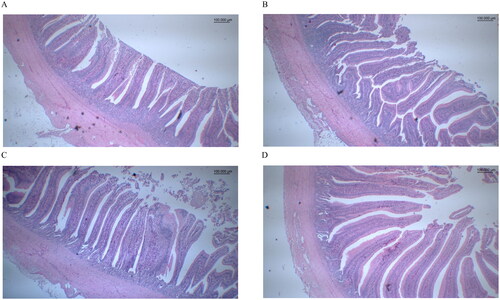
Table 9. Effect of specific sound frequency on jejunum-ileum morphology of laying hens.
Figure 3. (A) The distribution of amplicon sequence variants (ASVs) across both the control group and the Violin group were analysed. (B) Boxplots illustrating the alpha-diversity indices of both the control group and the Violin group were generated. The Shannon (a) and Simpson (b) indices are used to measure microbial diversity within samples, the observed features (c) represent the actual total species count within samples, the Pielou (d) index estimates species evenness within samples, and the Menhinick (e) and Margalef (f) indices estimate community richness based on the total number of species and total sample size.
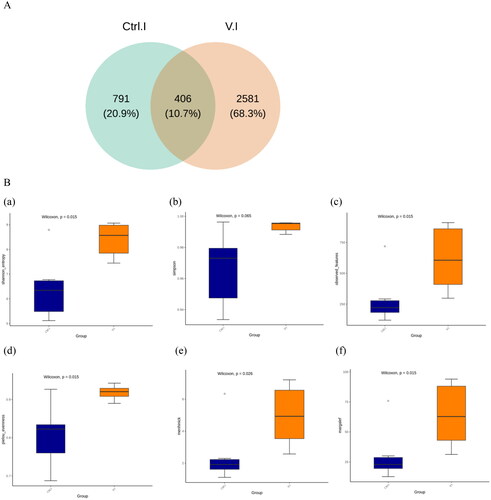
Figure 4. (A) Community composition of the gut microbiota among the control group and the Violin group of laying hens were analysed at the family (a), genus (b) and species (c) levels, respectively. (B) Welch’s test indicated significant differences at the genus (a) and species (b) levels. (C) MetagenomeSeq results exhibited significant differences at the genus (a) and species (b) level.
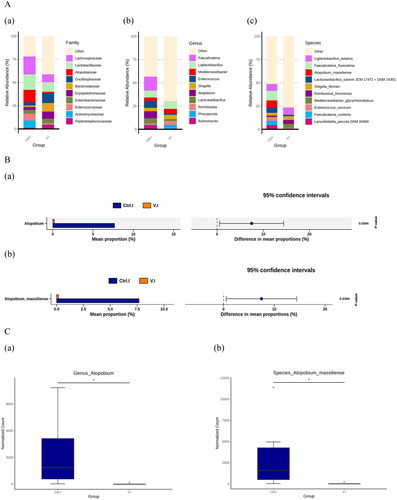
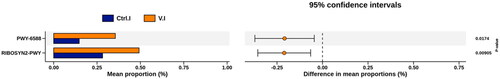
Figure 5. Two functions were detected existing significant difference in the control group and the Violin group by using PICRUSt.
Data availability statement
The data presented in this study are available on request from the corresponding author upon reasonable request.