
Figures & data
Table 1. Factor structure from two studies with normative comparison groups.
Table 2. Descriptive data for variables included in the statistical analysis.
Table 3. Means (standard deviations) for PSOC total scores for mothers and fathers. Results from comparing the means and the effect size.
Table 4. Means and standard deviations for PSOC subscales scores for mothers and fathers, and results from comparing the means and the effect sizes.
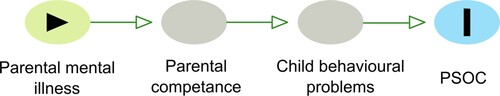
Figure 1. Illustration of the suggested causal relationships between parental mental illness and parenting sense of competence (PSOC). Note: The variables ‘Parenting competence' and ‘Child behavioural problems' are not measured in this study, but associations are described by previous research.
Data availability statement
Data can be made available on request to the corresponding author.