Figures & data
Figure 1. Questionnaire about low back pain site. The schematic figure was the view from the back.
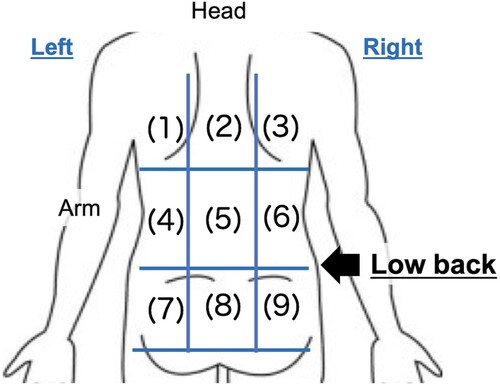
Figure 2. Incidence of paediatric low back pain induced by anteflexion (LBPAF) dependent on age.
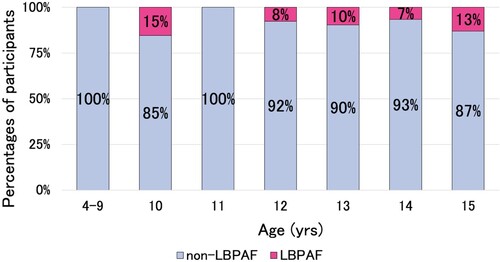
Figure 3. Methods for measuring muscle flexibility. A. FFD measures the flexibility of the hamstrings and the spinal column, showing in red and pink ellipses, respectively. B. The Ely test measures the flexibility of one of the anterior muscles, the rectus femoris muscle indicated by the red ellipse. The yellow arrow indicates the lower back and pelvis movement that occurs with decreased flexibility of the anterior thigh muscles. C. SLR-T measures the flexibility of the hamstrings, indicated by the red ellipse.
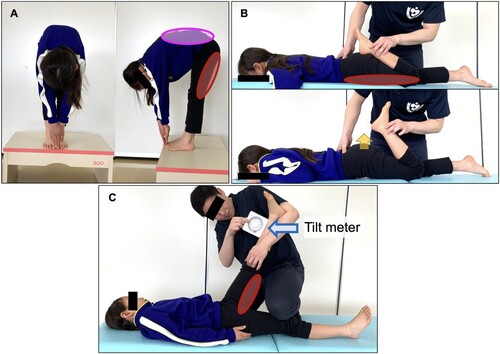
Figure 4. Protocol for creating training and test datasets to build MLR models. LBPAF, low back pain during anteflexion; MLR, multiple logistic regression; VIF, variance inflation factor; AIC, Akaike's information criterion
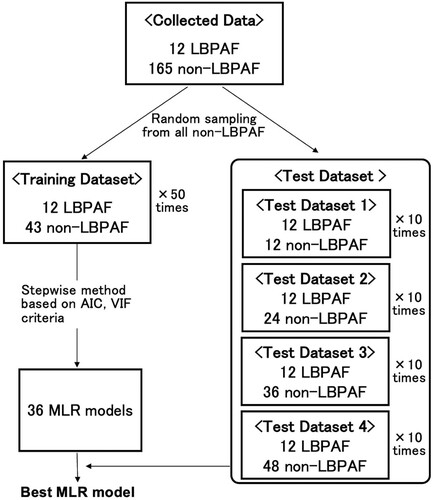
Table 1. Descriptive statistics by explanatory variables.
Table 2. Odds ratios of explanatory variables in the model.
Figure 5. Evaluation results of the explanatory variables in the proposed MLR models. For the statistical analysis, we first checked the normality of the distribution and the equality of the variances of the groups. If the distribution was normal and the variances were equal, one-way ANOVA and Tukey's test were adopted as a post-hoc test; otherwise the Bonferroni method was used. † indicates the results of the Bonferroni method, and no sign indicates the results of Tukey's test. * p < 0.05, ** p < 0.01, *** p < 0.001. W/o, without; FFD, finger floor distance; AUC, area under the curve. The top of the line extending upwards from the box is the maximum value and the bottom of the line is the minimum value. The top of the box shows the values is the upper quartile and the bottom of the box shows the values is the lower quartile. The line in the box is the median. The cross mark in the boxes is average.
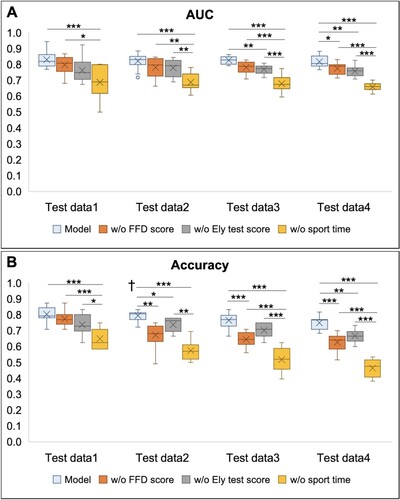
Figure 6. Specificity of the proposed MLR model. The top of the line extending upwards from the box is the maximum value and the bottom of the line is the minimum value. The top of the box shows the values is the upper quartile and the bottom of the box shows the values is the lower quartile. The line in the box is the median. The cross mark in the boxes is average.
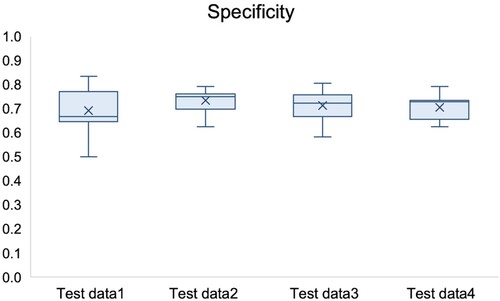
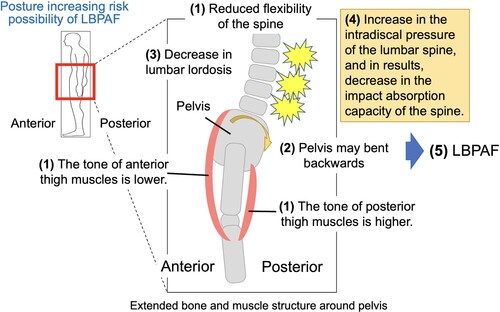
Figure 7. Presumed mechanism of paediatric LBPAF.