15,994
Views
25
CrossRef citations to date
0
Altmetric
Articles

The perception of the poor: Capturing stereotype content with different measures

ORCID Icon, &

Figures & data

Figure 1. The frequency distribution of the 20 categories with ≧ 10 words from the free association on the concept “Swedish citizens receiving welfare benefits.” Categories related to warmth/competence have solid black bars.
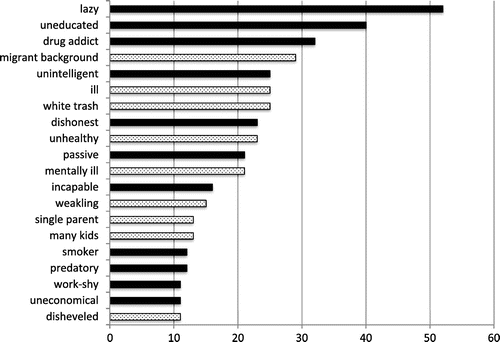
Figure 1. The frequency distribution of the 20 categories with ≧ 10 words from the free association on the concept “Swedish citizens receiving welfare benefits.” Categories related to warmth/competence have solid black bars.

Figure 2. Results from the Single Category Association Test. Primary axis shows correct responses in % (black bars), secondary axis shows response time in ms (patterned bars). X-axis indicates if the category “poor” was associated with “warm” or “cold.”
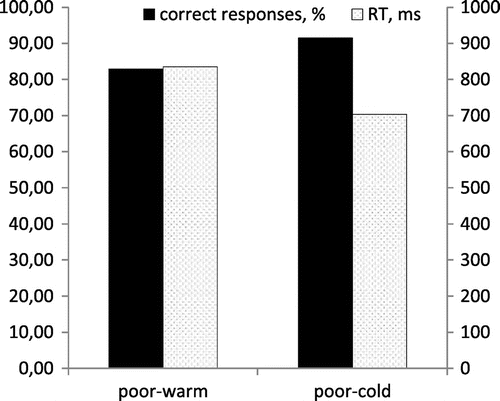
Figure 2. Results from the Single Category Association Test. Primary axis shows correct responses in % (black bars), secondary axis shows response time in ms (patterned bars). X-axis indicates if the category “poor” was associated with “warm” or “cold.”
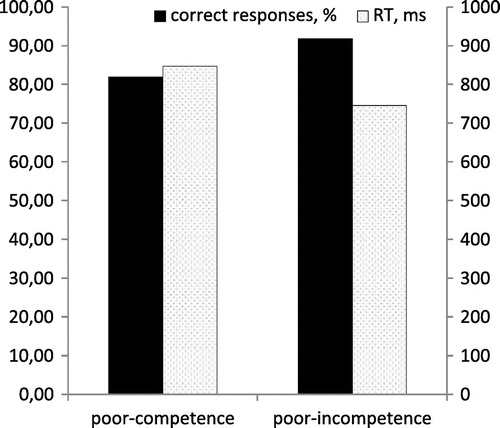
Figure 3. Results from the Single Category Association Test. Primary axis shows correct responses in % (black bars), secondary axis shows response time in ms (patterned bars). X-axis indicates if the category “poor” was associated with “competence” or “incompetence.”

Figure 3. Results from the Single Category Association Test. Primary axis shows correct responses in % (black bars), secondary axis shows response time in ms (patterned bars). X-axis indicates if the category “poor” was associated with “competence” or “incompetence.”

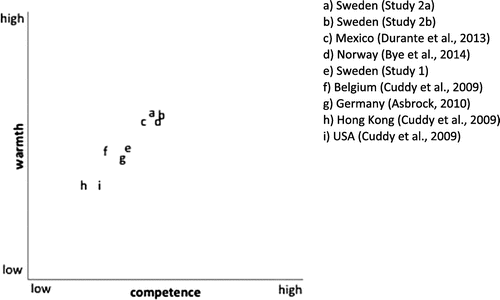
Figure 4. Explicit ratings of the poor on the two SCM-dimensions, from nine different studies (a–i).

Figure 4. Explicit ratings of the poor on the two SCM-dimensions, from nine different studies (a–i).