Figures & data
Figure 1 The Borg CR scale® (centiMax®, CR100) (© Borg & Borg, Citation1994, Citation2001, Citation2017; Borg, Citation2007, Borg et al., Citation2010; the scale and instructions can be obtained from www.borgperception.se. Printed by permission).
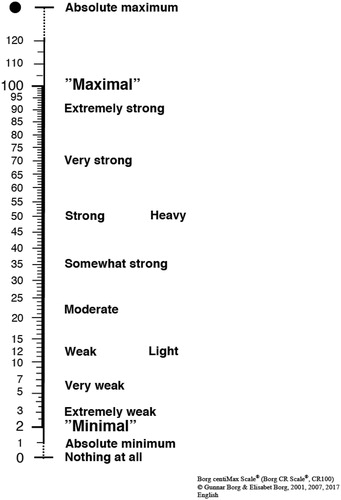
Figure 2 Scatterplot with regression line for the 50 participants and the overall amount of variance explained (R2).
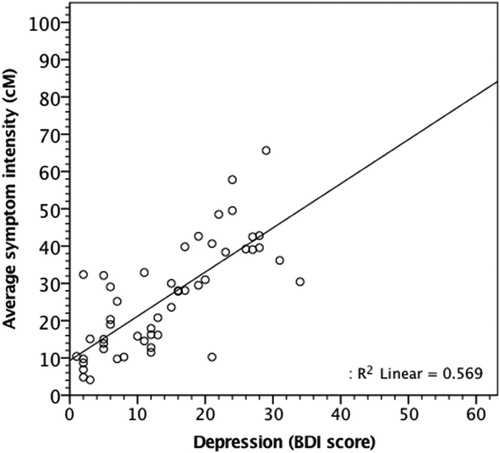
Table 1 The outcome of the Borg centiMax and the BDI (n = 50). Means and standard deviations of each item measured in cM and arranged in ascending order according to cM values.
Figure 3 A symptom profile for centiMax ratings of the intensity of depressive symptoms for two persons with the same BDI scores (28 points, moderate depression) and similar mean on the Borg centiMax Scale (Subj 1, full line, m = 43 cM, Subj 2, dashed line, m = 40 cM). The vertical line at 50 cM denotes a “Strong” feeling of the symptom (see ).
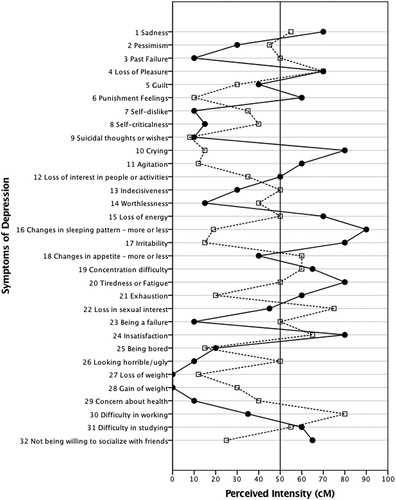
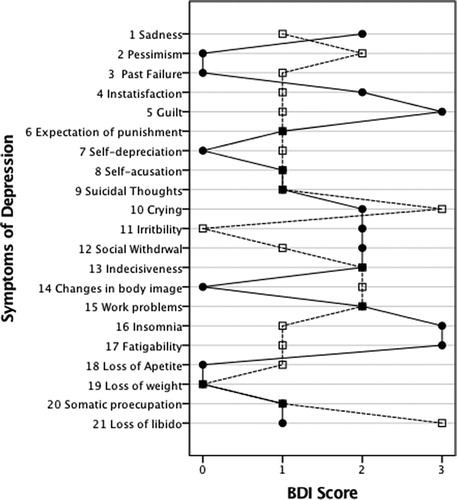
Figure 4 A symptom profile for depression measured with BDI (same two persons as in Figure 3). Note that the categories on the BDI Likert scale (0–3) are not necessarily perceptually equivalent for different symptoms.