
Figures & data
Table 1 Bivariate intercorrelations between the different variables of the status-pride model.
Table 2 Bivariate correlations (Pearson’s) between the components of the status-pride model and educational motivation.
Figure 1 Parental education and prestige.
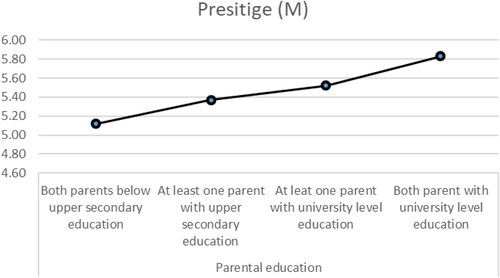
Figure 2 Parental education and authentic pride.
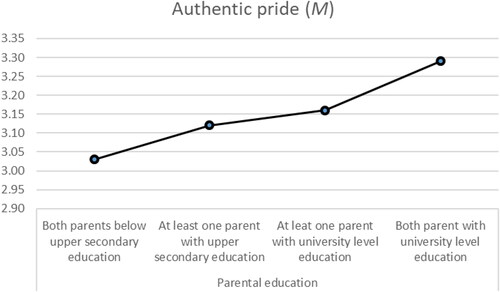
Table 3 Bivariate correlations (Pearson’s) between the components of the status-pride model and perceived barriers in life despite schooling (based on own experience and message from parents).
Table 4 Bivariate correlations (Pearson’s) for women and men between prestige, authentic pride, and educational motivation.
Table 5 Results of Fisher’s r-to-z test of the correlation coefficients for women and men between the components of the status-pride model and educational motivation.