
Figures & data
Table 1 Descriptives of the 67 patients presented in N, percentages and, where applicable, in medians and interquartile range (IQR).
Figure 1 Flowchart showing how the patients with ADHD, while on or off medication, performed the QbTest + at baseline (T1) and at a follow-up 4 years later (T2). “Scores above clinical cut-off” refers to the number of patients in a particular group who had Q-scores ≥ 1.25 on at least one of the cardinals. “Subclinical scores” refers to the number of patients in a particular group who had Q-scores < 1.25 on all of the cardinals.
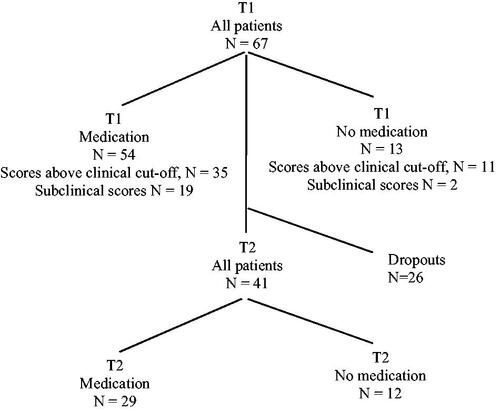
Figure 2 Box plots representing QbTest + performance in 67 patients diagnosed with ADHD. Some (N = 13) suspended taking their ADHD medicine on the day of testing (white boxes) and the others (N = 54) had medicated as usual (light grey boxes). Centre lines show the medians; box limits indicate the 25th and 75th percentiles; whiskers extend 1.5 times the interquartile range from the 25th and 75th percentiles. The notches represent the 95% confidence interval for each median. Non-overlapping notches give roughly 95% confidence that two medians differ.
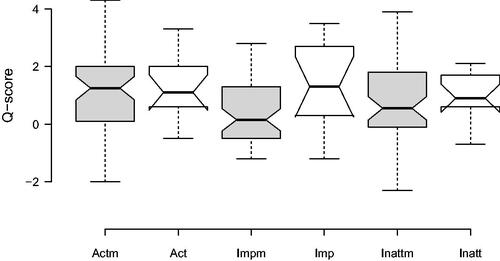
Table 2 Performance on the QbTest + and scores on self-reports (BADDS and ASRS) and clinical measures (GAF and CGI-S), presented as medians and interquartile ranges (IQR) in adult patients with a diagnosis of ADHD.
Table 3 Spearman correlation coefficients in non-medicated patients with ADHD (N = 13) between QbTest+ cardinals and self-reports (BADDS and ASRS) and clinical measures (GAF and CGI-S) at baseline (N = 13 (12 for CGI-S); upper panel) or at the 4-year follow-up (N = 7–8; lower panel).
Data availability statement
The datasets generated and/or analysed for this study are not publicly available due to the Swedish law for register data. However, data will be available from the corresponding author on reasonable request.