
Figures & data
Figure 1. Supervised sentiment analysis approach with distributed word embeddings.
Figure 2. Illustrative example of mapping sentiment to word embedding dimensions.
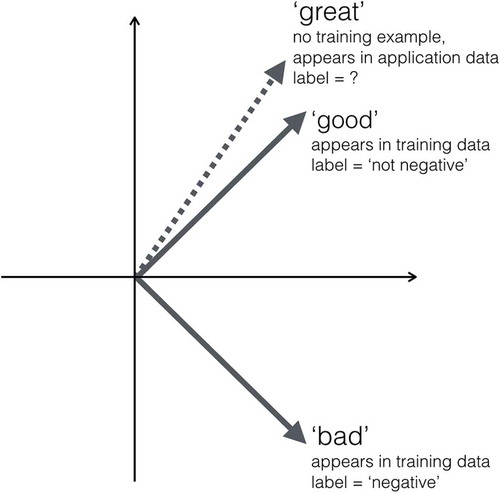
Figure 3. Negativity distribution of 20,600 training sentences ranging from 0 (not negative) to 4 (very negative), divided into three classes: not/slightly negative, negative and very negative.
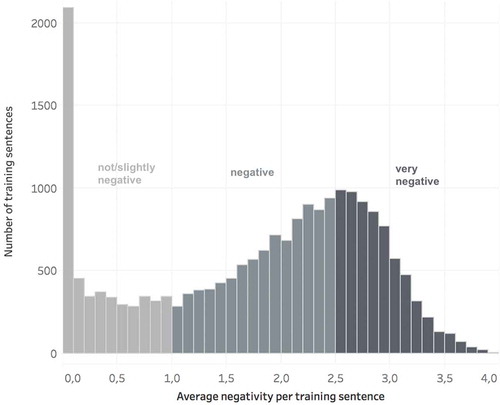
Table 1. Precision, recall, and F1 score for the bag of words approach.
Table 2. Precision, recall, and F1 score for the Word Embeddings approach.
Figure 4. Negativity evolution in the Austrian parliament from 1996 to 2013 showing those four parties that were present over the whole period.
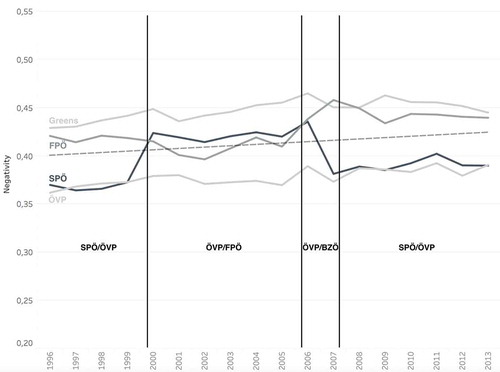
Figure 5. Negativity distinction per legislative term and parliamentary role: Average scores of cabinet members, MPs, and parliamentary party group leaders.
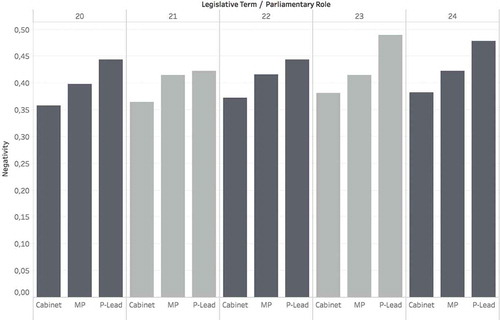
Figure 6. Negativity distinction per legislative term and type of debate: Average scores of Urgent Question Debates and all other types of debates.
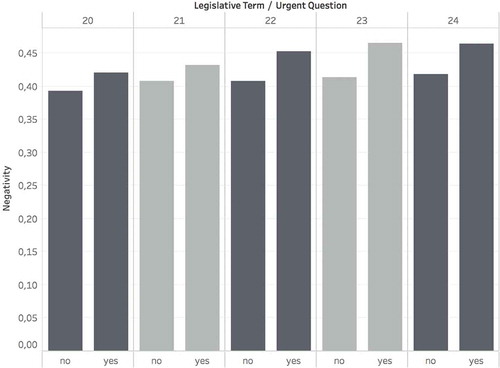
Table B1 Average confusion matrix for unseen test data: Bag-of-words
Table B2. Average confusion matrix for unseen test data: word embeddings.