Figures & data
Figure 1. Scraped messages by deletion status. Messages in dataset by day sent (a) and entity type (b).
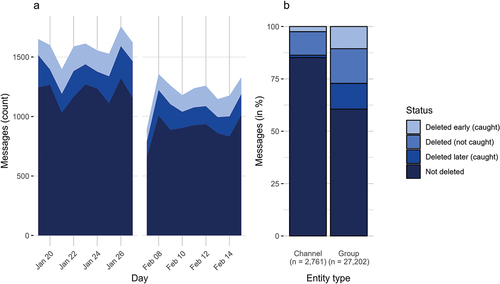
Table 1. Entity-level summary statistics of the recorded messages’ deletion status.
Figure 2. Histograms of random deletion tests. The histograms show the distribution of the data types of the randomly deleted messages. The red area delineates the confidence interval of two standard deviations from the mean. The blue line marks the number of deleted messages in the sample.
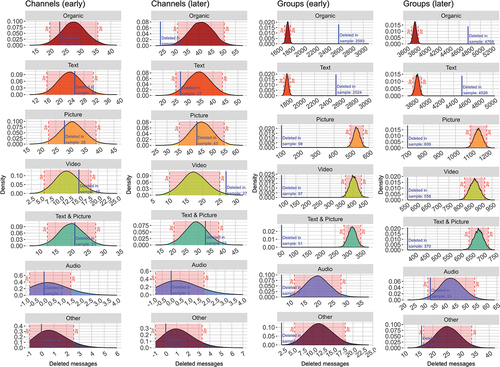
Figure 3. Kendall’s τ of most-used words in the sample. The shaded areas display the confidence interval of two standard deviations for the random deletion samples.
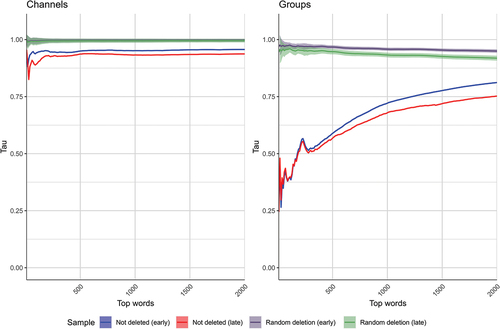
Figure 4. Analyses of deleted platform-internal references. a) Kendall’s τ of most-referenced entities in the sample: The shaded areas display the confidence interval of two standard deviations from the mean for the random deletion samples. b-c) Histograms of random deletion tests: The histograms show the distribution of referenced entities missing from the data after the random deletion of messages. The red area delineates the confidence interval of two standard deviations from the mean. The blue line marks the number of entities missing from the full dataset after excluding the deleted (caught) messages.
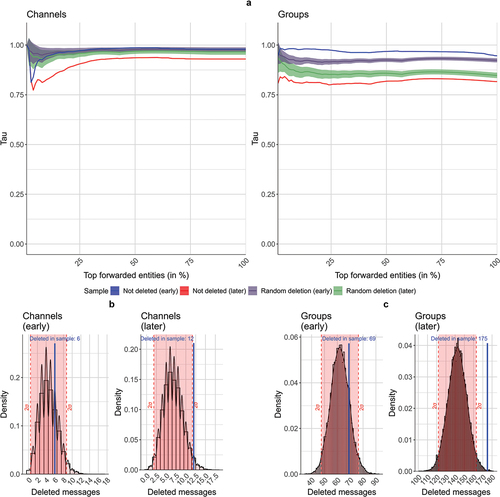
Figure 5. Analyses of deleted platform-external references. a) Kendall’s τ of most-referenced second-level domains in the sample: The shaded areas display the confidence interval of two standard deviations from the mean for the random deletion samples. b-c) Histograms of random deletion tests: The histograms show the distribution of referenced second-level domains missing from the data after the random deletion of messages. The red area delineates the confidence interval of two standard deviations from the mean. The blue line marks the number of domains missing from the full dataset after excluding the deleted (caught) messages.
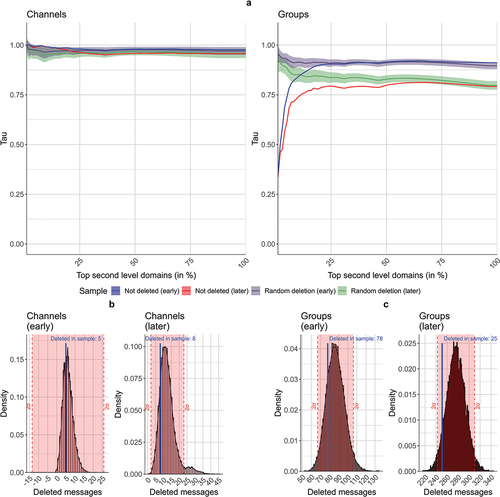
Figure 6. a) Replicability scores for correlated topic models estimated across different corpora and topic number specifications with full corpus topic estimations as reference; the bar showing the full corpus replicability denotes the reliability score as a reference. Bars denote mean replicability scores and standard deviations. b) Reliability scores for correlated topic models estimated from the same corpora and topic number specifications. Asterisks denote the level of significance resulting from a Mann – Whitney test for differences in sample distributions: ***p < 0.001; **p < 0.01; *p < 0.05.
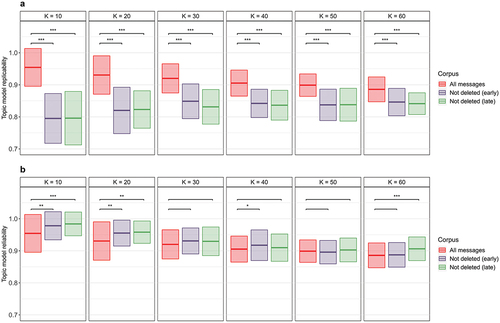
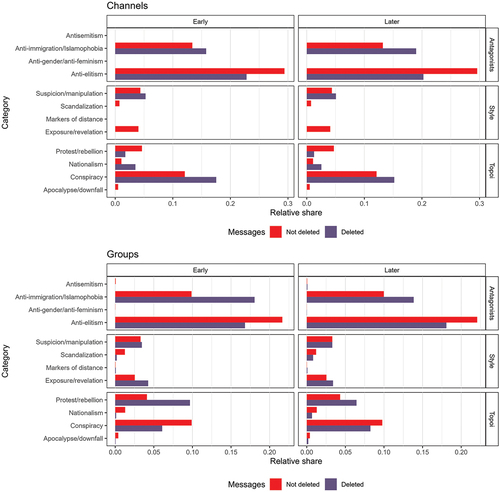
Figure 7. Computational dictionary analyses of deleted and nondeleted messages. The bars depict the relative share of messages and their respective category in the “Not deleted” and “Deleted” subsamples.