Figures & data
Table 1. Definitions of Sexual Pleasure.
Figure 1. A Sexual Response Surface.
Note. This graphic represents an illustrative visualization of a sexual response surface. This representation should not be overinterpreted as its shape needs to be verified by simulations and modeling of empirical data. For instance, a cusp surface (Huby, Citation1991; Levin, Citation2017) might better represent what happens during sexual responding, rather than the shape which is visualized here for illustrative purposes.
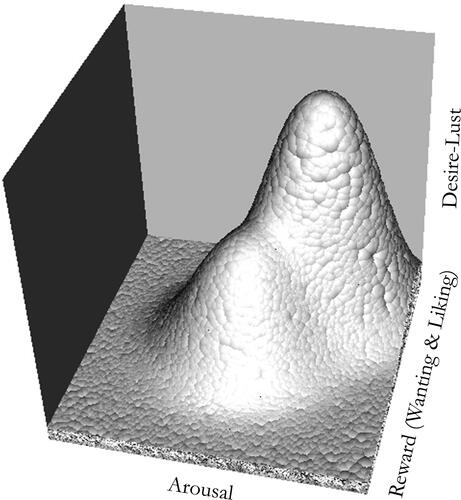
Figure 2. A Diagram of Sexual Response Concepts.
Note. The diagram does not specify causal mechanisms but conceptual relations and hierarchies.
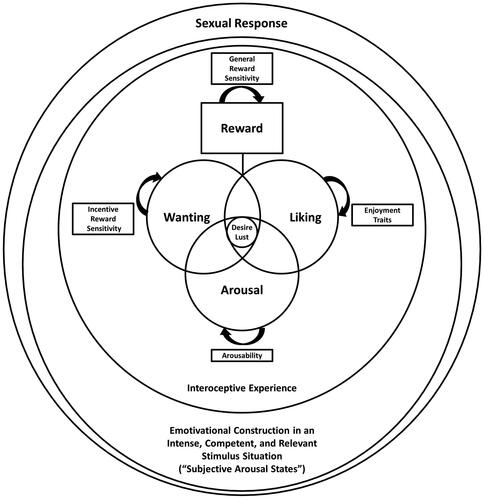
Table 2. Proposed Domains of (the Loose Trait Tendency for) State Sexual Pleasure and (Strict) Sexual Pleasure Traits.
Figure 3. A (Work in Progress) Diagram of the Sexual Response System.
Note. This diagram is based on and inspired by the work of Toates (Citation2009), Bancroft (Citation1999), Everaerd et al. (Citation2001), Janssen et al. (Citation2000), Barrett (Citation2017), DeYoung (Citation2015), and Robinaugh et al. (Citation2019). AE = Arousal Enjoyment; BE = Bonding Enjoyment; IE = Interaction Enjoyment; ESW = Enjoyment-related Self-Worth; ESE = Enjoyment-related Self-Efficacy; ET = Enjoyment Traits; A = Arousability; IncRS = Incentive Reward Sensitivity; GenRS = General Reward Sensitivity. Double arrows indicate that the respective processes feed back into each other during processing. Strict traits act as parameters of the functioning of the state-processes (how strongly, quickly, frequently these re/act).Footnote4 The sexual response surface is added to show that the response emerges as the output of affective processing within context through emotivational construction. The diagram is not exhaustive. For instance, future diagrams need to incorporate inhibitory processes.
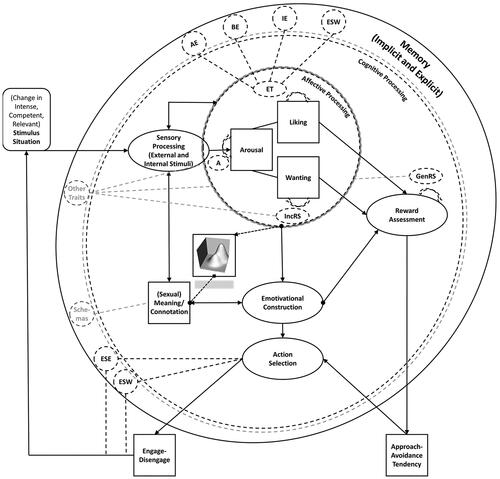
Figure 4. A Diagram of Sexual Pleasure and its Conceptual Relatives.
Note. The diagram does not specify causal mechanisms but conceptual overlap. We offer this visual alternative to the verbal conceptual specifications in the text.
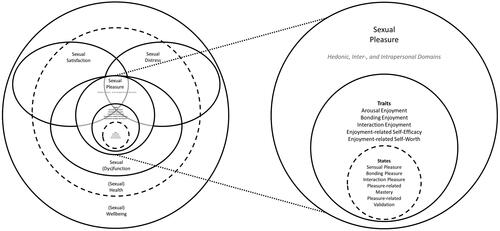
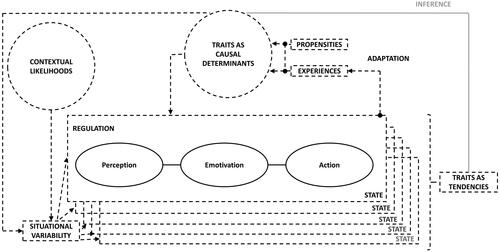
Figure 5. A Diagram of the Interrelationship between States and (Strict and Loose) Traits.
Note. The diagram is inspired by the work of Fleeson (Citation2001), DeYoung (Citation2015), and Robinaugh et al. (Citation2019). States are represented by each individual box, loose traits are represented as the tendency for experience across several state experiences, and strict traits are represented as causal factors that determine how a state (and thereby loose trait) evolves and regulates. States are further shaped by the situations in which they occur, with situational variability being affected by contextual likelihoods and the traits of the individual. The traits are a function of nature and nurture, with inborn propensities being shaped by experience through adaptation, which is a function of someone’s (state) experiences. Psychometrically, we often infer strict traits from (self-)reports of someone’s tendency for experience, i.e., loose traits. Adaptation occurs through different learning mechanisms, among which, as discussed here, conditioning and heterostasis. Regulation can occur through several mechanisms, among which, as discussed here, physiological homeostasis. Other mechanisms for adaptation and regulation exist, such as, for instance, social modeling (e.g., Bandura, Citation2005) and emotion regulation strategies (e.g., McRae & Gross, Citation2020) respectively.