Figures & data
Table 1. Description of race/ethnicity, urbanicity, demographic characteristics, motivations of store selection, and geographic food access of the sample.
Table 2. Mean differences findings exploring distances to self-reported supermarket and demographic and motivation of store-selection-related factors.
Table 3. Adjusted linear regression analytic findings exploring distances to closest supermarket and demographic and motivation of store-selection-related factors stratified by race/ethnicity.
Figure 1. Distribution of excess distance traveled to utilized supermarket by race/ethnicity.
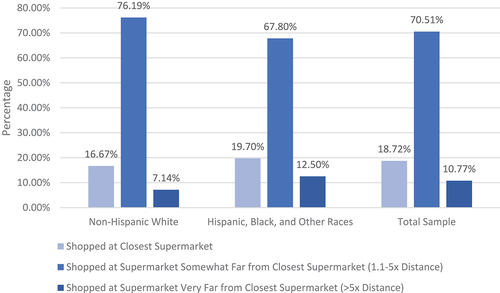
Figure 2. Distribution oF excess distance traveled to utilized supermarket by urbanicity.
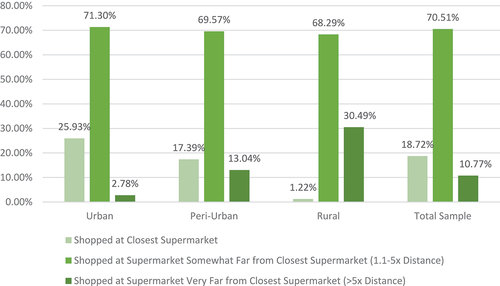
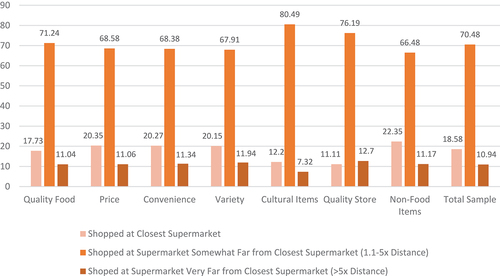
Figure 3. Distribution of excess distance traveled to utilized supermarket by main shopping motivation.