
Figures & data
Figure 1. Conceptual framework.
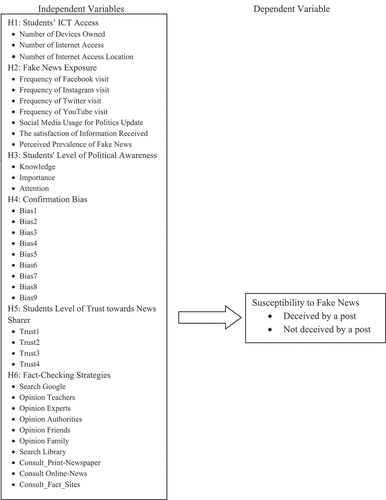
Table 1. Likert scale, mean range, and its verbal interpretation
Table 2. ICT access of students
Table 3. Fake news exposure and level of awareness
Table 4. Confirmation bias and trust toward news sharers
Table 5. Fact-checking strategies
Table 6. Logistic regression analysis of susceptibility of students on fake news