1,203
Views
6
CrossRef citations to date
0
Altmetric
Research Papers

Establishment of a simple cell-based ELISA for the direct detection of abnormal isoform of prion protein from prion-infected cells without cell lysis and proteinase K treatment

, , , &
Pages 305-318 | Received 13 Jan 2016, Accepted 06 May 2016, Published online: 26 Aug 2016

Figures & data

Figure 1. MAb 132 discriminates prion-infected cells from uninfected cells in cell-based ELISA. Prion-infected cells (ScN2a-3-22L) and uninfected cells (N2a-3) were cultured in 96-well plates for 72 h. Cells were then fixed with PFA, permeabilized with Trion X-100, and treated with (GdnSCN+) or without (GdnSCN−) 5 M GdnSCN. After blocking, the cells were subjected to immunostaining with various anti-PrP antibodies at the indicated concentrations. MAb P2-284 was used as a negative control.
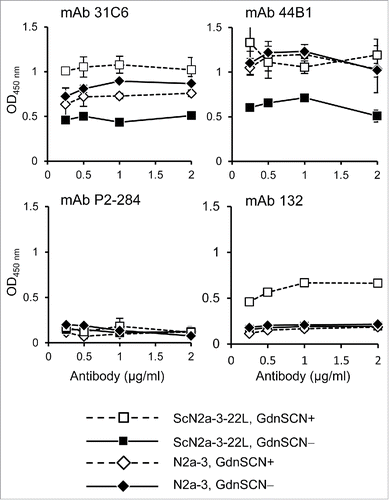
Figure 1. MAb 132 discriminates prion-infected cells from uninfected cells in cell-based ELISA. Prion-infected cells (ScN2a-3-22L) and uninfected cells (N2a-3) were cultured in 96-well plates for 72 h. Cells were then fixed with PFA, permeabilized with Trion X-100, and treated with (GdnSCN+) or without (GdnSCN−) 5 M GdnSCN. After blocking, the cells were subjected to immunostaining with various anti-PrP antibodies at the indicated concentrations. MAb P2-284 was used as a negative control.

Figure 2. Dynamic range of PrPSc detection in cell-based ELISA. ScN2a-3-22L cell suspension (1.0 × 10⁵ cells/ml) was 2-fold serially diluted with a N2a-3 cell suspension of the same concentration. Cell suspensions (10,000 cells/100μl/well) were added to wells and incubated for 72 h. After the incubation, the cells were subjected to PrPSc detection with mAb 132. The cutoff value (dotted line) was determined as the mean plus 3 × SD of the N2a-3 signal. Numbers with plots indicate percentages of ScN2a-3-22L cells to total cells in well.
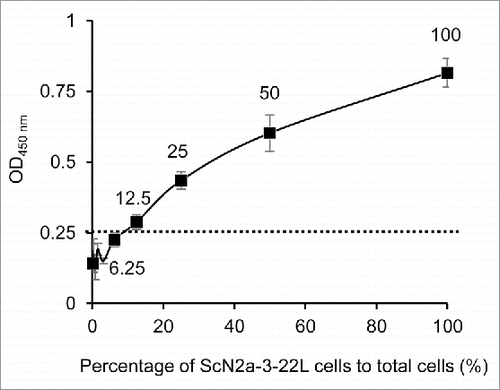
Figure 2. Dynamic range of PrPSc detection in cell-based ELISA. ScN2a-3-22L cell suspension (1.0 × 10⁵ cells/ml) was 2-fold serially diluted with a N2a-3 cell suspension of the same concentration. Cell suspensions (10,000 cells/100μl/well) were added to wells and incubated for 72 h. After the incubation, the cells were subjected to PrPSc detection with mAb 132. The cutoff value (dotted line) was determined as the mean plus 3 × SD of the N2a-3 signal. Numbers with plots indicate percentages of ScN2a-3-22L cells to total cells in well.

Figure 3. Detection of PrPSc of other prion strains and from other cell types. N2a-3 cells persistently infected with the 22L (ScN2a-3-22L), and the Chandler prion strain (ScN2a-3-Ch), and GT1-7 cells infected with the 22L prion strain (ScGT1-7-22L), were cultured in 96-well plates. After 72 h incubation, the cells were subjected to PrPSc detection with mAb 132 (open and closed circles). MAb P2-284 (open and closed diamonds) was used as a negative control mAb.
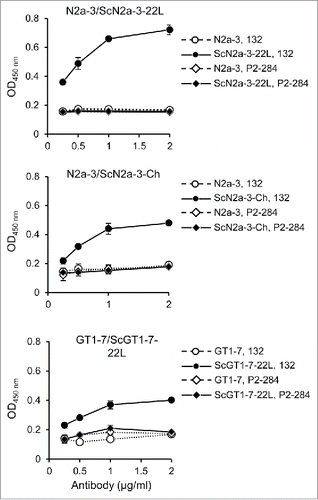
Figure 3. Detection of PrPSc of other prion strains and from other cell types. N2a-3 cells persistently infected with the 22L (ScN2a-3-22L), and the Chandler prion strain (ScN2a-3-Ch), and GT1-7 cells infected with the 22L prion strain (ScGT1-7-22L), were cultured in 96-well plates. After 72 h incubation, the cells were subjected to PrPSc detection with mAb 132 (open and closed circles). MAb P2-284 (open and closed diamonds) was used as a negative control mAb.

TABLE 1. Reliability of novel cell-based ELISA.

Figure 4. Utility of cell-based ELISA in combination with cytotoxicity assay. (A and B) Influence of the cytotoxicity assay on subsequent PrPSc detection. ScN2a-3-22L cells were cultured in 96-well plates for 24 h and then incubated with U18666A (A) or PPS (B) for 48 h at the indicated concentrations. Immediately before fixation, cell viability was measured with the WST assay using CCK-8. After removal of the CCK-8 reagent, cells were subjected to PrPSc detection in the same plate. Regarding PrPSc detection, PrPSc signals detected after the WST assay (WST+, open diamonds and circles) or without WST assay (WST−, closed diamonds and circles) are shown. The dashed lines in WST assay indicate survival rate at 80%. The PrPSc signal detected from N2a-3 cells was used to calculate cutoff values (mean plus 3 × SD) for PrPSc detection (dashed lines). (C) IFA for PrPSc detection. ScN2a-3-22L cells were cultured in a chambered coverglass for 24 h and then treated or with U18666A or PPS for 48 h at the indicated concentrations. ScN2a-3-22L and N2a-3 cells untreated with these compounds were used as positive and negative controls for PrPSc, respectively. The cells were subjected to PrPSc-specific straining with mAb 132 (green), and cell nuclei were counterstained with 4', 6-diamidino-2-phenylindole (DAPI) (blue). (D) Expression of PrPC in N2a-3 and ScN2a-3-22L cells. Cells were stained with mAb 31C6 (green) without pretreatment of GdnSCN for the detection of PrPC. Nuclei were counterstained with DAPI (blue). P2-284: negative control mAb. Scale bar: 20 μm. (E) Immunoblot analysis. ScN2a-3-22L cells were cultured in 24-well plates for 24 h and subsequently treated with U18666A or PPS for 48 h at the indicated concentrations. Cells were then subjected to immunoblot analysis for the detection of PrPSc-res. N2a-3 cells untreated with these compounds were used as negative controls for PrPSc-res. PrPSc-res levels relative to untreated ScN2a-3-22L cells are shown at the bottom. Scale bar: 20 μm.
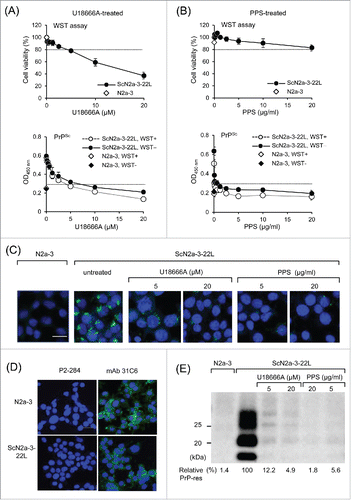
Figure 4. Utility of cell-based ELISA in combination with cytotoxicity assay. (A and B) Influence of the cytotoxicity assay on subsequent PrPSc detection. ScN2a-3-22L cells were cultured in 96-well plates for 24 h and then incubated with U18666A (A) or PPS (B) for 48 h at the indicated concentrations. Immediately before fixation, cell viability was measured with the WST assay using CCK-8. After removal of the CCK-8 reagent, cells were subjected to PrPSc detection in the same plate. Regarding PrPSc detection, PrPSc signals detected after the WST assay (WST+, open diamonds and circles) or without WST assay (WST−, closed diamonds and circles) are shown. The dashed lines in WST assay indicate survival rate at 80%. The PrPSc signal detected from N2a-3 cells was used to calculate cutoff values (mean plus 3 × SD) for PrPSc detection (dashed lines). (C) IFA for PrPSc detection. ScN2a-3-22L cells were cultured in a chambered coverglass for 24 h and then treated or with U18666A or PPS for 48 h at the indicated concentrations. ScN2a-3-22L and N2a-3 cells untreated with these compounds were used as positive and negative controls for PrPSc, respectively. The cells were subjected to PrPSc-specific straining with mAb 132 (green), and cell nuclei were counterstained with 4', 6-diamidino-2-phenylindole (DAPI) (blue). (D) Expression of PrPC in N2a-3 and ScN2a-3-22L cells. Cells were stained with mAb 31C6 (green) without pretreatment of GdnSCN for the detection of PrPC. Nuclei were counterstained with DAPI (blue). P2-284: negative control mAb. Scale bar: 20 μm. (E) Immunoblot analysis. ScN2a-3-22L cells were cultured in 24-well plates for 24 h and subsequently treated with U18666A or PPS for 48 h at the indicated concentrations. Cells were then subjected to immunoblot analysis for the detection of PrPSc-res. N2a-3 cells untreated with these compounds were used as negative controls for PrPSc-res. PrPSc-res levels relative to untreated ScN2a-3-22L cells are shown at the bottom. Scale bar: 20 μm.

Figure 5. Detection of PrPSc-sen and PrPSc-res by mAb 132 in a dot-blot analysis. (A) Dot-blot analysis. Lysates from N2a-3 or ScN2a-3-22L cells were transferred onto PDVF membranes using a dot-blotter (quadruplicates). The membranes were treated with PK (10 μg/ml; PK+) (III) or not (PK−) (I and II) for 1 h at RT and subsequently with (Gdn+) (II and III) or without (Gdn−) 3 M GdnSCN (II) for 30 min at RT, or in the reverse order (IV and V). Then, the membranes were stained with mAb 132, and chemiluminescence signals were detected and quantified with a LAS 3000 chemiluminescence image analyzer. The PrP levels (%) relative to the PrP level in II, detected using mAb 132, are shown in (B). *, p < 0.05, Student's t-test). (C) Confirmation of PrPC in dot-blot analysis. Lysates from N2a-3 (Mock) or ScN2a-3-22L (22L) cells were blotted onto PDVF membranes (quadruplicates). The membranes were treated with PK (10 μg/ml) or not (0 μg/ml) for 1 h at RT. After the termination of PK digestion, the membranes were treated with DNase I and then with 3 M GdnSCN for 30 min at RT as described in Materials and Methods. Finally membranes were stained with mAbs 132 and 31C6 for chemiluminescence detection.
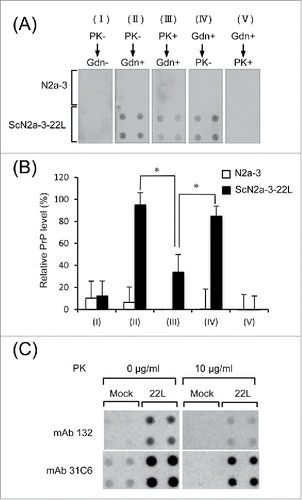
Figure 5. Detection of PrPSc-sen and PrPSc-res by mAb 132 in a dot-blot analysis. (A) Dot-blot analysis. Lysates from N2a-3 or ScN2a-3-22L cells were transferred onto PDVF membranes using a dot-blotter (quadruplicates). The membranes were treated with PK (10 μg/ml; PK+) (III) or not (PK−) (I and II) for 1 h at RT and subsequently with (Gdn+) (II and III) or without (Gdn−) 3 M GdnSCN (II) for 30 min at RT, or in the reverse order (IV and V). Then, the membranes were stained with mAb 132, and chemiluminescence signals were detected and quantified with a LAS 3000 chemiluminescence image analyzer. The PrP levels (%) relative to the PrP level in II, detected using mAb 132, are shown in (B). *, p < 0.05, Student's t-test). (C) Confirmation of PrPC in dot-blot analysis. Lysates from N2a-3 (Mock) or ScN2a-3-22L (22L) cells were blotted onto PDVF membranes (quadruplicates). The membranes were treated with PK (10 μg/ml) or not (0 μg/ml) for 1 h at RT. After the termination of PK digestion, the membranes were treated with DNase I and then with 3 M GdnSCN for 30 min at RT as described in Materials and Methods. Finally membranes were stained with mAbs 132 and 31C6 for chemiluminescence detection.

Figure 6. Possible detection of PrPSc-sen and PrPSc-res using mAb 132 in IFA. N2a-3 and ScN2a-3-22L cells and were cultured in a chambered coverglass for 24 h. Cells were fixed with 4% paraformaldehyde in PBS for 10 min and then treated with 0.1% Triton X-100 and 0.1 M glycine in PBS. Subsequently, cells were treated with PK at the indicated concentrations at 4°C for 30 min. Cells were then treated with 5 M GdnSCN for 10 min at RT and subjected to PrPSc-specific immunofluorescence staining. Representative fluorescence images of two independent experiments are shown at the top. Graphs show the corresponding quantification result of PrPSc fluorescence intensities (FI) per ScN2a-3-22L cell. Fluorescence intensities from perinuclear regions of N2a-3 were subtracted as background. Experiment 1: mean fluorescence intensities and standard deviations of 16 cells from 5 microscopic fields (3–4 cells/field). Experiment 2: mean fluorescence intensities and standard deviations of 16–24 cells from 4 to 5 microscopic fields (3–5 cells/field). *, p < 0.001, Welch's t-test). Scale bars: 10 μm.
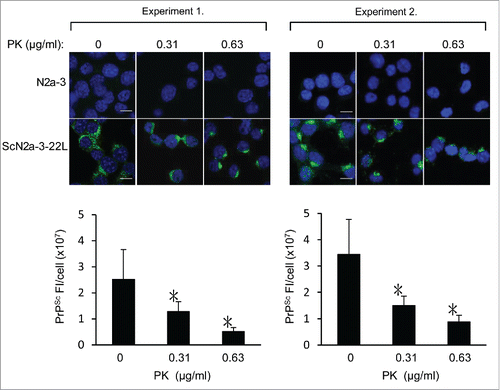
Figure 6. Possible detection of PrPSc-sen and PrPSc-res using mAb 132 in IFA. N2a-3 and ScN2a-3-22L cells and were cultured in a chambered coverglass for 24 h. Cells were fixed with 4% paraformaldehyde in PBS for 10 min and then treated with 0.1% Triton X-100 and 0.1 M glycine in PBS. Subsequently, cells were treated with PK at the indicated concentrations at 4°C for 30 min. Cells were then treated with 5 M GdnSCN for 10 min at RT and subjected to PrPSc-specific immunofluorescence staining. Representative fluorescence images of two independent experiments are shown at the top. Graphs show the corresponding quantification result of PrPSc fluorescence intensities (FI) per ScN2a-3-22L cell. Fluorescence intensities from perinuclear regions of N2a-3 were subtracted as background. Experiment 1: mean fluorescence intensities and standard deviations of 16 cells from 5 microscopic fields (3–4 cells/field). Experiment 2: mean fluorescence intensities and standard deviations of 16–24 cells from 4 to 5 microscopic fields (3–5 cells/field). *, p < 0.001, Welch's t-test). Scale bars: 10 μm.

Reprints and Corporate Permissions

Please note: Selecting permissions does not provide access to the full text of the article, please see our help page How do I view content?

To request a reprint or corporate permissions for this article, please click on the relevant link below:

Academic Permissions

Please note: Selecting permissions does not provide access to the full text of the article, please see our help page How do I view content?

Obtain permissions instantly via Rightslink by clicking on the button below:

If you are unable to obtain permissions via Rightslink, please complete and submit this Permissions form. For more information, please visit our Permissions help page.