4,868
Views
13
CrossRef citations to date
0
Altmetric
Extra Views

Transmissibility of Gerstmann–Sträussler–Scheinker syndrome in rodent models: New insights into the molecular underpinnings of prion infectivity

, , &
Pages 421-433 | Received 10 Aug 2016, Accepted 19 Sep 2016, Published online: 28 Nov 2016

Figures & data

FIGURE 1. Schematic representation of PrPres fragments in GSS with P102L, F198S and A117V mutations. In full length PrP (upper cartoon) the glycosylation sites “N” (aa 181 and 197) and the epitopes of monoclonal antibodies SAF32 (black, octarepeat), 12B2 (green, aa 89–93), 9A2 (red, aa 99–101), L42 (blue, aa 145–150) used for epitope mapping are shown. Cleavage sites of protease resistant PrPres fragments after digestion with protease K are depicted according to Pirisinu et al., 2013. PrPres from brain of P102L patients is characterized by ∼8 kDa PrPres cleaved at N-terminus (aa ∼78–82) and C-terminus (aa ∼150), which is accompanied in some cases by a classical ∼21 kDa PrPres. F198S PrPres spans aa ∼74 to ∼146–150, while A117V PrPres is characterized by a smaller fragment spanning from aa ∼90–96 to 146.
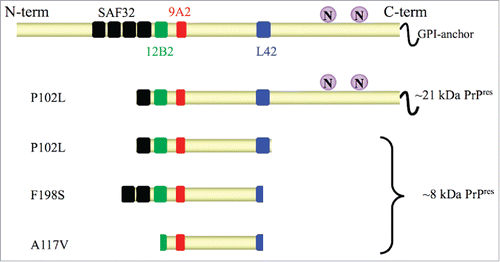
FIGURE 1. Schematic representation of PrPres fragments in GSS with P102L, F198S and A117V mutations. In full length PrP (upper cartoon) the glycosylation sites “N” (aa 181 and 197) and the epitopes of monoclonal antibodies SAF32 (black, octarepeat), 12B2 (green, aa 89–93), 9A2 (red, aa 99–101), L42 (blue, aa 145–150) used for epitope mapping are shown. Cleavage sites of protease resistant PrPres fragments after digestion with protease K are depicted according to Pirisinu et al., 2013. PrPres from brain of P102L patients is characterized by ∼8 kDa PrPres cleaved at N-terminus (aa ∼78–82) and C-terminus (aa ∼150), which is accompanied in some cases by a classical ∼21 kDa PrPres. F198S PrPres spans aa ∼74 to ∼146–150, while A117V PrPres is characterized by a smaller fragment spanning from aa ∼90–96 to 146.

FIGURE 2. Primary transmission of GSS A117V, F198S and P102L cases in bank voles. Schematic representation of the electrophoretic patterns of PrPres accumulated in brains of patients used as inocula (left panels) and in the inoculated bank voles (middle panels). Different PrPres types are represented by different colors. For each PrPres type the denaturation-resistant multimers (for ∼8 kDa PrPres types) and the glycosylated isoforms (∼21 kDa PrPres) are represented as color gradient bands. Molecular weights (kDa) are indicated on the left. The representation of PrPres profiles mimics the profiles observed by western blot with 9A2 mAb. The right panels show a schematic representation of the neuropathological phenotypes observed in terminally ill bank voles which accumulated the PrPres type reported within each box. Each box shows 2 groups of standard coronal sections of the vole brain which depict the spongiform changes (tonal values of red) and the PrPSc deposition (tonal values of blue). Arrows, colored according to the PrPres types, indicate the groups of voles in which the depicted neuropathological phenotype was observed. Note that the neuropathological phenotypes which characterize 7 kDa PrPres (red box) and 8 kDa PrPres (black box) are similar, while that of 21 kDa PrPres (green box) is clearly distinct from the others. The survival time of voles varied significantly depending on the PrPres type, and was between 83 and 266 d post-inoculation (dpi) in voles showing 7 kDa PrPres, between 168 and 375 dpi in voles with 8 kDa PrPres and between 644 and 804 dpi in voles with 21 kDa PrPres.
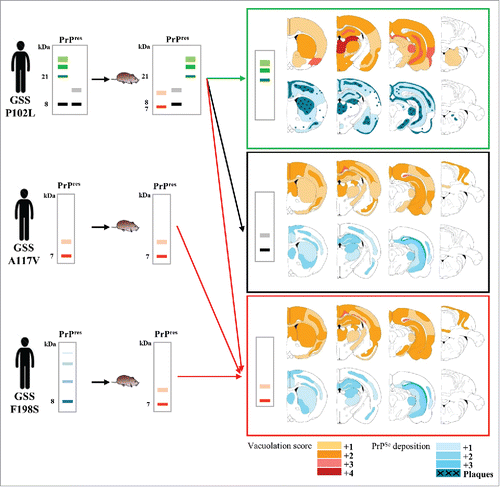
FIGURE 2. Primary transmission of GSS A117V, F198S and P102L cases in bank voles. Schematic representation of the electrophoretic patterns of PrPres accumulated in brains of patients used as inocula (left panels) and in the inoculated bank voles (middle panels). Different PrPres types are represented by different colors. For each PrPres type the denaturation-resistant multimers (for ∼8 kDa PrPres types) and the glycosylated isoforms (∼21 kDa PrPres) are represented as color gradient bands. Molecular weights (kDa) are indicated on the left. The representation of PrPres profiles mimics the profiles observed by western blot with 9A2 mAb. The right panels show a schematic representation of the neuropathological phenotypes observed in terminally ill bank voles which accumulated the PrPres type reported within each box. Each box shows 2 groups of standard coronal sections of the vole brain which depict the spongiform changes (tonal values of red) and the PrPSc deposition (tonal values of blue). Arrows, colored according to the PrPres types, indicate the groups of voles in which the depicted neuropathological phenotype was observed. Note that the neuropathological phenotypes which characterize 7 kDa PrPres (red box) and 8 kDa PrPres (black box) are similar, while that of 21 kDa PrPres (green box) is clearly distinct from the others. The survival time of voles varied significantly depending on the PrPres type, and was between 83 and 266 d post-inoculation (dpi) in voles showing 7 kDa PrPres, between 168 and 375 dpi in voles with 8 kDa PrPres and between 644 and 804 dpi in voles with 21 kDa PrPres.