Figures & data
TABLE 1. Allele frequencies in woodland caribou populations.
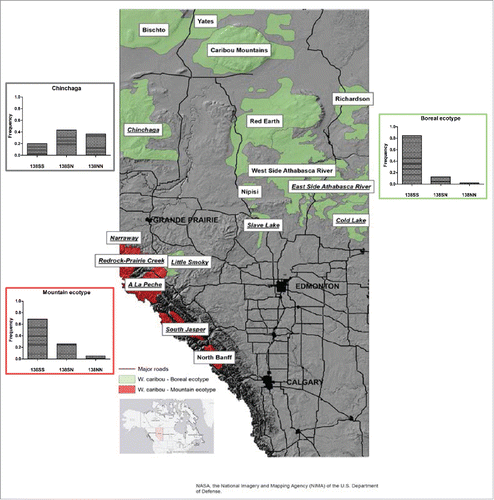
FIGURE 1. Geographic distribution and Prnp allele frequencies at codon 138 of woodland caribou populations. The map indicates the distribution of all woodland caribou populations in Alberta, those classified as boreal ecotype are depicted in green, the populations of the mountain ecotype in red. Populations included in our study are underlined. Bar graphs indicate the frequency of 138SS, 138SN and 138NN genotypes of all analyzed population of the mountain and boreal ecotype excluding Chinchaga, which is shown in a separate bar graph.