1,623
Views
20
CrossRef citations to date
0
Altmetric
Short Communications

Flow cytometric measurement of the cellular propagation of TDP-43 aggregation

, , , , , , & ORCID Icon show all
Pages 195-204 | Received 13 Jan 2017, Accepted 28 Mar 2017, Published online: 16 May 2017

Figures & data

Figure 1. FloIT quantifies TDP-43 inclusions in NSC-34 cells. NSC‐34 cells were transiently transfected with either TDP-43WT–tdTomato or TDP-43G294A-tGFP fusion proteins and incubated for either 24, 48 or 72 h. (A, D) Confocal microscopy identifies extra nuclear TDP-43 that has formed distinct inclusions (white arrow head; Scale bar 5 μm). Dashed line represents cell border from transmission image enclosed line represents the nucleus. (B, E) Representative 2 parameter, pseudo-color flow cytometry plots showing identification of nuclei and non-nuclear particles (indicated) on the basis of forward scatter (FSC; arbitrary units, AU) and RedDot2 fluorescence (arbitrary fluorescence units, AFU). (C, F). Non-nuclear particles (gated as shown in representative plots (B, E)) analyzed for tdTomato (C) or tGFP (F) fluorescence versus FSC in lysates prepared from cells transfected with plasmids encoding TDP-43WT–tdTomato or TDP-43G294A-tGFP or fluorescent proteins alone (left). Inclusions are identified by their tdTomato or tGFP fluorescence. (G, H) Quantification of inclusions (FloIT) as number of inclusions per 100 transfected cells formed by TDP-43G294A-tGFP and TDP-43WT–tdTomato, compared with lysates prepared from cells expressing fluorescent proteins only. Results shown are the mean number of inclusions per 100 transfected cells ± SEM, n = 3 independent experiments. Significant differences indicated with p value represent unpaired T-test comparisons between treatments indicated by line.
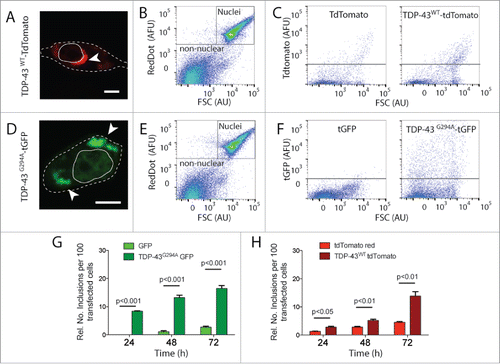
Figure 1. FloIT quantifies TDP-43 inclusions in NSC-34 cells. NSC‐34 cells were transiently transfected with either TDP-43WT–tdTomato or TDP-43G294A-tGFP fusion proteins and incubated for either 24, 48 or 72 h. (A, D) Confocal microscopy identifies extra nuclear TDP-43 that has formed distinct inclusions (white arrow head; Scale bar 5 μm). Dashed line represents cell border from transmission image enclosed line represents the nucleus. (B, E) Representative 2 parameter, pseudo-color flow cytometry plots showing identification of nuclei and non-nuclear particles (indicated) on the basis of forward scatter (FSC; arbitrary units, AU) and RedDot2 fluorescence (arbitrary fluorescence units, AFU). (C, F). Non-nuclear particles (gated as shown in representative plots (B, E)) analyzed for tdTomato (C) or tGFP (F) fluorescence versus FSC in lysates prepared from cells transfected with plasmids encoding TDP-43WT–tdTomato or TDP-43G294A-tGFP or fluorescent proteins alone (left). Inclusions are identified by their tdTomato or tGFP fluorescence. (G, H) Quantification of inclusions (FloIT) as number of inclusions per 100 transfected cells formed by TDP-43G294A-tGFP and TDP-43WT–tdTomato, compared with lysates prepared from cells expressing fluorescent proteins only. Results shown are the mean number of inclusions per 100 transfected cells ± SEM, n = 3 independent experiments. Significant differences indicated with p value represent unpaired T-test comparisons between treatments indicated by line.
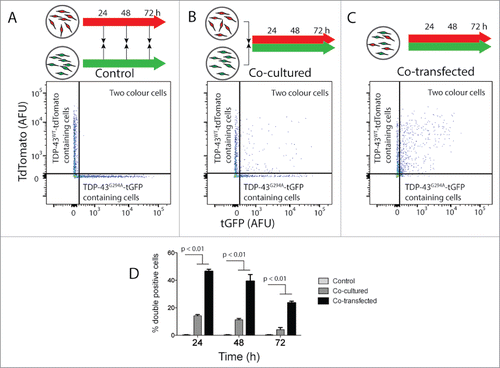
Figure 2. TDP-43WT or TDP-43G294A proteins can transfer from cell to cell in NSC-34 cells. NSC‐34 transiently transfected with TDP-43WT-tdTomato or TDP-43G294A-tGFP were either mixed (indicated by black arrows in schematic diagram) at the end of the incubation (A), immediately following transfection (B). Alternatively, cells were co-transfected to express both fusion proteins (C). After incubation for either 24, 48 or 72 h live intact cells were analyzed by flow cytometry. (A-C) Representative 2 parameter, pseudo-color flow cytometry plots showing identification of cells expressing TDP-43WT-tdTomato or TDP-43G294A-tGFP and cells containing both from the 48 h timepoint. (D) Histogram showing double positive cells as a percentage of all cells containing a fluorescent protein. Results shown as mean percentage of cells ± SEM, n = 3 independent experiments. Significant differences indicated with p value represent unpaired T-test comparisons between treatments indicated by line.
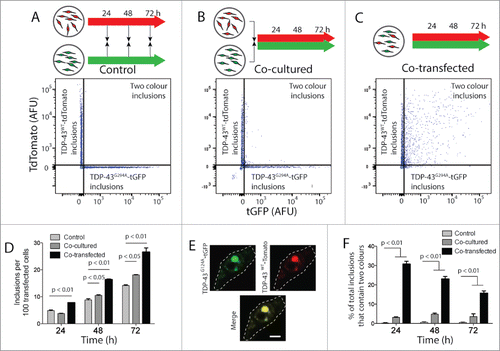
Figure 2. TDP-43WT or TDP-43G294A proteins can transfer from cell to cell in NSC-34 cells. NSC‐34 transiently transfected with TDP-43WT-tdTomato or TDP-43G294A-tGFP were either mixed (indicated by black arrows in schematic diagram) at the end of the incubation (A), immediately following transfection (B). Alternatively, cells were co-transfected to express both fusion proteins (C). After incubation for either 24, 48 or 72 h live intact cells were analyzed by flow cytometry. (A-C) Representative 2 parameter, pseudo-color flow cytometry plots showing identification of cells expressing TDP-43WT-tdTomato or TDP-43G294A-tGFP and cells containing both from the 48 h timepoint. (D) Histogram showing double positive cells as a percentage of all cells containing a fluorescent protein. Results shown as mean percentage of cells ± SEM, n = 3 independent experiments. Significant differences indicated with p value represent unpaired T-test comparisons between treatments indicated by line.

Figure 3. FloIT detects 2-color inclusions NSC-34 cell lysates. NSC‐34 transiently transfected with TDP-43WT-tdTomato or TDP-43G294A-tGFP were either mixed at the end of the incubation (A), or immediately following transfection (B). Alternatively, cells were co-transfected to express both fusion proteins (C). After incubation for either 24, 48 or 72 h cells were lysed and analyzed by FloIT. (A-C) Two-parameter, pseudo-color flow cytometry plots showing identification of inclusions containing TDP-43WT-tdTomato or TDP-43G294A-tGFP and inclusions containing both. (D) The total number of TDP-43WT-tdTomato inclusions including dual color inclusions were enumerated by FloIT and are shown as means ± SEM (n = 3). (E) Confocal microscopy of an NSC-34 cell with an inclusion containing both TDP-43WT-tdTomato and TDP-43G294A-tGFP. Dashed line represents cell border from transmission image. Scale bar 5 μm. (F) The percentage of TDP-43 inclusions formed in each treatment at time intervals that contained both TDP-43WT-tdTomato and TDP-43G294A-tGFP enumerated by FloIT are shown as means ± SEM (n = 3 independent experiments). Significant differences indicated with p value represent unpaired T-test comparisons between treatments indicated by line.

Figure 3. FloIT detects 2-color inclusions NSC-34 cell lysates. NSC‐34 transiently transfected with TDP-43WT-tdTomato or TDP-43G294A-tGFP were either mixed at the end of the incubation (A), or immediately following transfection (B). Alternatively, cells were co-transfected to express both fusion proteins (C). After incubation for either 24, 48 or 72 h cells were lysed and analyzed by FloIT. (A-C) Two-parameter, pseudo-color flow cytometry plots showing identification of inclusions containing TDP-43WT-tdTomato or TDP-43G294A-tGFP and inclusions containing both. (D) The total number of TDP-43WT-tdTomato inclusions including dual color inclusions were enumerated by FloIT and are shown as means ± SEM (n = 3). (E) Confocal microscopy of an NSC-34 cell with an inclusion containing both TDP-43WT-tdTomato and TDP-43G294A-tGFP. Dashed line represents cell border from transmission image. Scale bar 5 μm. (F) The percentage of TDP-43 inclusions formed in each treatment at time intervals that contained both TDP-43WT-tdTomato and TDP-43G294A-tGFP enumerated by FloIT are shown as means ± SEM (n = 3 independent experiments). Significant differences indicated with p value represent unpaired T-test comparisons between treatments indicated by line.
Supplemental material

Supplemental_Material.zip

Download Zip (5.4 MB)

Reprints and Corporate Permissions

Please note: Selecting permissions does not provide access to the full text of the article, please see our help page How do I view content?

To request a reprint or corporate permissions for this article, please click on the relevant link below:

Academic Permissions

Please note: Selecting permissions does not provide access to the full text of the article, please see our help page How do I view content?

Obtain permissions instantly via Rightslink by clicking on the button below:

If you are unable to obtain permissions via Rightslink, please complete and submit this Permissions form. For more information, please visit our Permissions help page.