850
Views
6
CrossRef citations to date
0
Altmetric
Research Papers

Remarkable increases of α1-antichymotrypsin in brain tissues of rodents during prion infection

, , , , , , , , , , & show all
Pages 338-351 | Received 10 Apr 2017, Accepted 28 Jun 2017, Published online: 12 Oct 2017

Figures & data

FIGURE 1. Comparative analyses of the levels of α1-ACT in the brains of the scrapie-infected rodent models. a Western blots of the brain homogenates of various scrapie-infected rodent models at the terminal stage and the individual age-matched normal ones. Each group contains three individual animals. The scrapie strains are indicated on the top of each graph and the quantitative assays of the various blots normalized with the data of β-actin are indicated on the left. b Representative IHC assays of α1-ACT in the sections of various brain regions of 263K-infected hamsters at terminal stage, including the cortex, thalamus and cerebellum (presenting on the top side). The relevant brain sections of normal hamsters are used as control (40 ×). The magnified images are shown under each picture. c Representative IHC analyses of α1-ACT in the sections of various brain regions of 139A-infected (upper panel) and ME7-infected (lower panel) mice at terminal stage (40 ×).
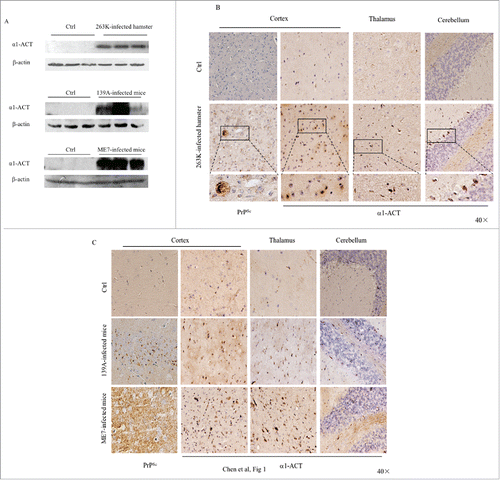
FIGURE 1. Comparative analyses of the levels of α1-ACT in the brains of the scrapie-infected rodent models. a Western blots of the brain homogenates of various scrapie-infected rodent models at the terminal stage and the individual age-matched normal ones. Each group contains three individual animals. The scrapie strains are indicated on the top of each graph and the quantitative assays of the various blots normalized with the data of β-actin are indicated on the left. b Representative IHC assays of α1-ACT in the sections of various brain regions of 263K-infected hamsters at terminal stage, including the cortex, thalamus and cerebellum (presenting on the top side). The relevant brain sections of normal hamsters are used as control (40 ×). The magnified images are shown under each picture. c Representative IHC analyses of α1-ACT in the sections of various brain regions of 139A-infected (upper panel) and ME7-infected (lower panel) mice at terminal stage (40 ×).

FIGURE 2. Dynamic assays of the alterations of α1-ACT, total PrP and PrPSc in the brains of prion-infected rodent models during incubation periods. a Western blots for α1-ACT, total PrP and PrPSc in the brain of 263K-infected hamsters. The brain samples were collected 0, 20, 40, 60, 80 dpi. b Western blots for α1-ACT, total PrP and PrPSc in the brain of ME7-infected mice. The brain samples were collected 0, 86, 117, 147, 179 dpi. Various blots are indicated on the left. The quantitative analysis of gray values of total PrP and PrPSc is presented on the right.
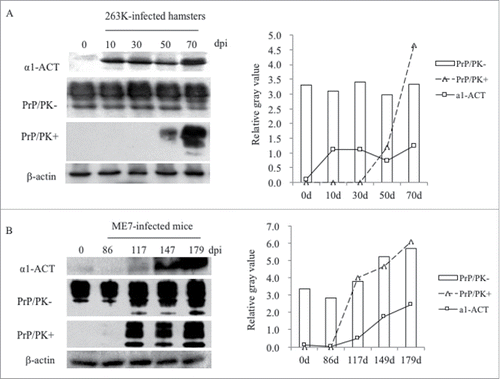
FIGURE 2. Dynamic assays of the alterations of α1-ACT, total PrP and PrPSc in the brains of prion-infected rodent models during incubation periods. a Western blots for α1-ACT, total PrP and PrPSc in the brain of 263K-infected hamsters. The brain samples were collected 0, 20, 40, 60, 80 dpi. b Western blots for α1-ACT, total PrP and PrPSc in the brain of ME7-infected mice. The brain samples were collected 0, 86, 117, 147, 179 dpi. Various blots are indicated on the left. The quantitative analysis of gray values of total PrP and PrPSc is presented on the right.

FIGURE 3. Immunofluorescent analyses of the relationships of α1-ACT with various sorts of cells in the brains of 263K-infected hamsters at the end of disease and the age-matched normal hamsters as control. a-c Representative images of the hamsters' brains double-immunostained with the antibodies of α1-ACT (green) and GFAP, (red) (a), Iba1 (red) (b), or NeuN (red) (c) (100 ×). The zoomed-in pictures are shown on the bottom. d Analyses of the IOD values with the software in Operatta. The average IOD values of α1-ACT per cell (× 105) (left panel), per GFAP-positive cell (× 105) (middle panel) as well as per Iba1-positive cell (× 105) (right panel). Statistical differences between infected and normal animals are indicated above.
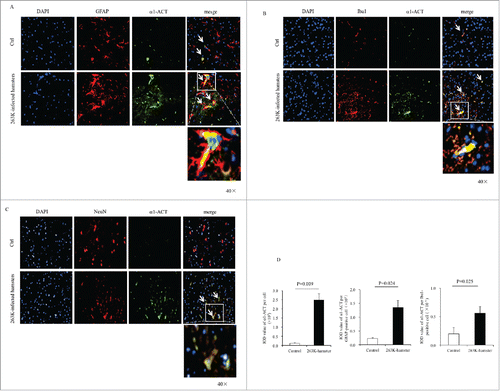
FIGURE 3. Immunofluorescent analyses of the relationships of α1-ACT with various sorts of cells in the brains of 263K-infected hamsters at the end of disease and the age-matched normal hamsters as control. a-c Representative images of the hamsters' brains double-immunostained with the antibodies of α1-ACT (green) and GFAP, (red) (a), Iba1 (red) (b), or NeuN (red) (c) (100 ×). The zoomed-in pictures are shown on the bottom. d Analyses of the IOD values with the software in Operatta. The average IOD values of α1-ACT per cell (× 105) (left panel), per GFAP-positive cell (× 105) (middle panel) as well as per Iba1-positive cell (× 105) (right panel). Statistical differences between infected and normal animals are indicated above.

FIGURE 4. Analyses of the association of α1-ACT with PrP in brain tissues. a Representative images of double-stained IFA assays with the antibodies of α1-ACT (green) and PrP (red) on the brain sections of normal and 263K-infected hamsters (100 ×). The zoomed-in pictures are shown on the bottom. b Representative images of IHC assays for α1-ACT and PrPSc in the serial sections of different brain regions of 263K-infected hamsters, including cortex, thalamus and cerebellum (indicated above). The magnified images are shown on the top right of each picture and the positions of the observing fields within the whole brain are indicated on the left.
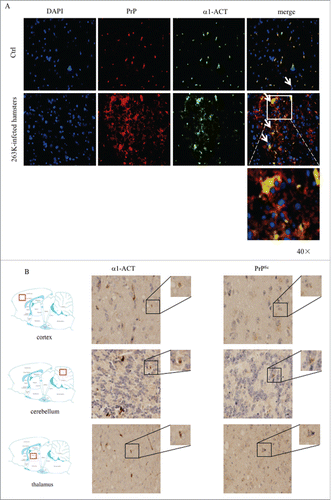
FIGURE 4. Analyses of the association of α1-ACT with PrP in brain tissues. a Representative images of double-stained IFA assays with the antibodies of α1-ACT (green) and PrP (red) on the brain sections of normal and 263K-infected hamsters (100 ×). The zoomed-in pictures are shown on the bottom. b Representative images of IHC assays for α1-ACT and PrPSc in the serial sections of different brain regions of 263K-infected hamsters, including cortex, thalamus and cerebellum (indicated above). The magnified images are shown on the top right of each picture and the positions of the observing fields within the whole brain are indicated on the left.

FIGURE 5. Evaluation of the molecular interaction between endogenous α1-ACT and PrP with immunoprecipitation assays. a Brain homogenates of normal and 263K-infected hamsters. The proteins in homogenates were precipitated with pAbs against α1-ACT or rabbit IgG (marked as isotype) and subsequently evaluated by PrP-specific Western blots. b Lysates of SMB-S15 and SMB-PS cells. The proteins in cell lysates were precipitated with pAb α1-ACT or rabbit IgG (marked as isotype) and subsequently evaluated by PrP-specific Western blots. Aliquots of brain homogenates or cell lysates (marked as input) were directly loaded into SDS-PAGE as internal controls. HC and LC represent the heavy chain and light chain of IgG.
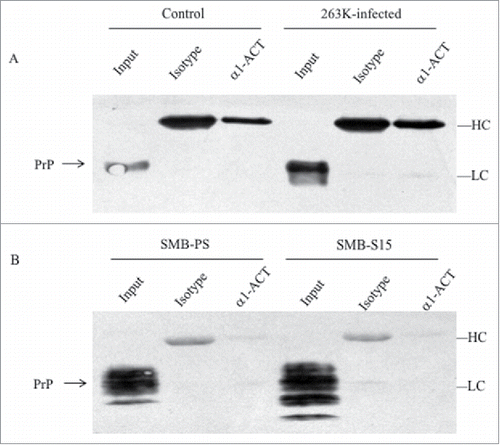
FIGURE 5. Evaluation of the molecular interaction between endogenous α1-ACT and PrP with immunoprecipitation assays. a Brain homogenates of normal and 263K-infected hamsters. The proteins in homogenates were precipitated with pAbs against α1-ACT or rabbit IgG (marked as isotype) and subsequently evaluated by PrP-specific Western blots. b Lysates of SMB-S15 and SMB-PS cells. The proteins in cell lysates were precipitated with pAb α1-ACT or rabbit IgG (marked as isotype) and subsequently evaluated by PrP-specific Western blots. Aliquots of brain homogenates or cell lysates (marked as input) were directly loaded into SDS-PAGE as internal controls. HC and LC represent the heavy chain and light chain of IgG.
Supplemental material

Supplemental_Material.zip

Download Zip (450.1 KB)

Reprints and Corporate Permissions

Please note: Selecting permissions does not provide access to the full text of the article, please see our help page How do I view content?

To request a reprint or corporate permissions for this article, please click on the relevant link below:

Academic Permissions

Please note: Selecting permissions does not provide access to the full text of the article, please see our help page How do I view content?

Obtain permissions instantly via Rightslink by clicking on the button below:

If you are unable to obtain permissions via Rightslink, please complete and submit this Permissions form. For more information, please visit our Permissions help page.