738
Views
6
CrossRef citations to date
0
Altmetric
Research Papers

Aberrant alterations of the expressions and S-nitrosylation of calmodulin and the downstream factors in the brains of the rodents during scrapie infection

, , , , , , , , , & show all
Pages 352-367 | Received 08 May 2017, Accepted 08 Aug 2017, Published online: 12 Oct 2017

Figures & data

FIGURE 1. Upregulation of CaM in the brains of scrapie-infected rodents. A. Western blot analysis of CaM in the brain homogenates of scrapie agents 263K-infected hamsters collected at terminal stage. The same amounts of individual brain homogenate were loaded and analyzed by 12% SDS-PAGE. β-actin was used as an internal control. The scrapie agent 263K as well as normal control is shown on the top of the graphs. The densities of signals are determined by densitometry and shown relative to CaM/β-actin. Graphical data denote mean+SD (n = 3). Statistical differences compared with controls are illustrated on the top. B. Dynamic assays of CaM in the brain tissues of normal and 263K-infected hamsters during the incubation period. Experiments were repeated three times. Various specific immunoblots are marked on the right and the time-point of the day post-inoculation is shown as dpi. The gray values of each line are shown relative to CaM/β-actin. C. Representative IHC assays of CaM in the cortex, thalamus and cerebellum of 263K-infected hamsters and normal controls (40 ×).
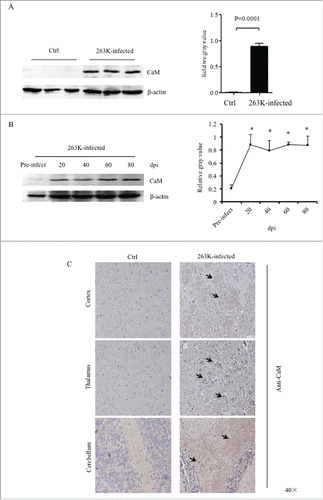
FIGURE 1. Upregulation of CaM in the brains of scrapie-infected rodents. A. Western blot analysis of CaM in the brain homogenates of scrapie agents 263K-infected hamsters collected at terminal stage. The same amounts of individual brain homogenate were loaded and analyzed by 12% SDS-PAGE. β-actin was used as an internal control. The scrapie agent 263K as well as normal control is shown on the top of the graphs. The densities of signals are determined by densitometry and shown relative to CaM/β-actin. Graphical data denote mean+SD (n = 3). Statistical differences compared with controls are illustrated on the top. B. Dynamic assays of CaM in the brain tissues of normal and 263K-infected hamsters during the incubation period. Experiments were repeated three times. Various specific immunoblots are marked on the right and the time-point of the day post-inoculation is shown as dpi. The gray values of each line are shown relative to CaM/β-actin. C. Representative IHC assays of CaM in the cortex, thalamus and cerebellum of 263K-infected hamsters and normal controls (40 ×).

FIGURE 2. Immunofluorescent analysis of the associations of CaM with different kinds of CNS cells of normal and scrapie-infected hamsters collected at early and terminal stage. Representative images double-immunostained with the antibodies for CaM (green) and GFAP (red) on the slices from the hamsters of 20 dpi (A) and 80 dpi (B), or that for NeuN (red) from the hamsters of 20 dpi (C) and 80 dpi (D) (× 40). The normal controls are the individual age-matched healthy hamsters. The merged signals are shown with the white arrow. E. Analyses of the IOD values with the software in Operatta. The average IOD values of CaM per NeuN-positive cell (× 105). Left panel: the infected hamsters of 20 dpi. Right panel: the infected hamsters of 80 dpi. Statistical differences between the infected animals and the individual normal controls are indicated above.
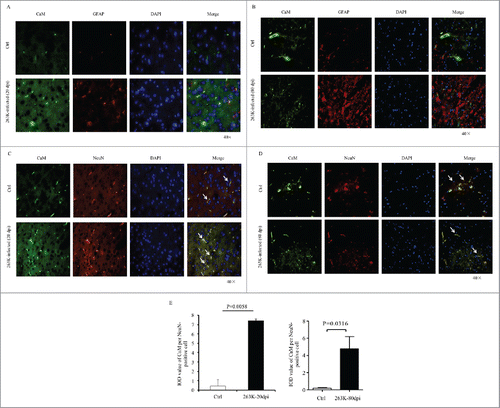
FIGURE 2. Immunofluorescent analysis of the associations of CaM with different kinds of CNS cells of normal and scrapie-infected hamsters collected at early and terminal stage. Representative images double-immunostained with the antibodies for CaM (green) and GFAP (red) on the slices from the hamsters of 20 dpi (A) and 80 dpi (B), or that for NeuN (red) from the hamsters of 20 dpi (C) and 80 dpi (D) (× 40). The normal controls are the individual age-matched healthy hamsters. The merged signals are shown with the white arrow. E. Analyses of the IOD values with the software in Operatta. The average IOD values of CaM per NeuN-positive cell (× 105). Left panel: the infected hamsters of 20 dpi. Right panel: the infected hamsters of 80 dpi. Statistical differences between the infected animals and the individual normal controls are indicated above.

FIGURE 3. Downregulation of CaMKs and phospho-CaMKs (p-CaMKs) in the brains of scrapie infected hamsters. Western blots analysis of CaMKIIα, CaMKIIβ and p-CaMKIIα (T286) (A), as well as CaMKIV and p-CaMKIV (T196+T200) (B) in the brain homogenates of scrapie agent 263K-infected hamsters collected at moribund stage. C. Dynamic analysis of the CaMKIIα, CaMKIIβ and p-CaMKII (T286) in the brains of 263K-infected hamsters during incubation periods. The brain samples were collected 0, 20, 40, 60, 80 dpi and pooled with three individual hamsters. D. Western blots for CREB, p-CREB (S133) and BDNF in the brain homogenates of scrapie agents 263K-infected hamsters collected at end stage. The same amounts of individual brain homogenate were loaded and analyzed by 12% SDS-PAGE. β-actin was used as an internal control. The quantitative analysis of the signal densities of CaMKs, p-CaMKs, CREB, p-CREB and BDNF were normalized with that of β-actin. Graphical data denote mean+SD.
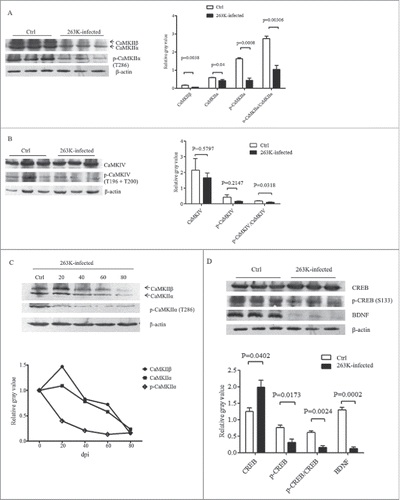
FIGURE 3. Downregulation of CaMKs and phospho-CaMKs (p-CaMKs) in the brains of scrapie infected hamsters. Western blots analysis of CaMKIIα, CaMKIIβ and p-CaMKIIα (T286) (A), as well as CaMKIV and p-CaMKIV (T196+T200) (B) in the brain homogenates of scrapie agent 263K-infected hamsters collected at moribund stage. C. Dynamic analysis of the CaMKIIα, CaMKIIβ and p-CaMKII (T286) in the brains of 263K-infected hamsters during incubation periods. The brain samples were collected 0, 20, 40, 60, 80 dpi and pooled with three individual hamsters. D. Western blots for CREB, p-CREB (S133) and BDNF in the brain homogenates of scrapie agents 263K-infected hamsters collected at end stage. The same amounts of individual brain homogenate were loaded and analyzed by 12% SDS-PAGE. β-actin was used as an internal control. The quantitative analysis of the signal densities of CaMKs, p-CaMKs, CREB, p-CREB and BDNF were normalized with that of β-actin. Graphical data denote mean+SD.

FIGURE 4. Evaluations of the levels of CaM and associated agents in scrapie cell line SMB-S15 and its normal cell line SMB-PS. Western blots for CaM (A), CaMKIIα and p-CaMKIIα (B), CaMKIV and p-CaMKIV (C), as well as CREB, p-CREB and BDNF (D). β-actin was used as an internal control and illustrated under each blot. The quantitative analyses of gray values of each blot after normalized with the individual β-actin are shown on the right. The average relative gray value is calculated from three independent blots and presented as mean+SD.
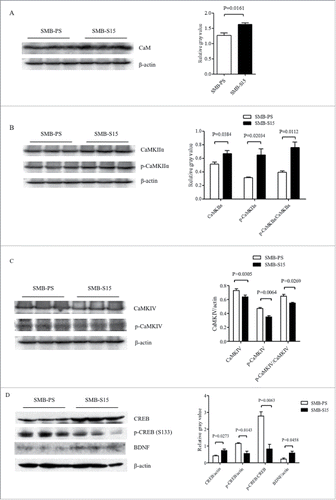
FIGURE 4. Evaluations of the levels of CaM and associated agents in scrapie cell line SMB-S15 and its normal cell line SMB-PS. Western blots for CaM (A), CaMKIIα and p-CaMKIIα (B), CaMKIV and p-CaMKIV (C), as well as CREB, p-CREB and BDNF (D). β-actin was used as an internal control and illustrated under each blot. The quantitative analyses of gray values of each blot after normalized with the individual β-actin are shown on the right. The average relative gray value is calculated from three independent blots and presented as mean+SD.

FIGURE 5. Analysis of the levels of CaMKs, p-CaMKs, CREB, p-CREB and BDNF in the fractions of the nucleus and cytoplasm of SMB cells. Western blots for CaMKIIα, p-CaMKIIα, CaMKIV and p-CaMKIV (A) as well as CREB, p-CREB and BDNF (B) in the fractions of the nucleus and cytoplasm of the cells. N: nucleus, C: cytoplasm. Various blots are shown on the left. Gray value analysis of the signals of CaMKs, p-CaMKs, CREB, p-CREB and BDNF in nucleus and cytosolic fractions are shown on the right. The quantitative results are collected from three independent experiments and are presented as mean+SD.
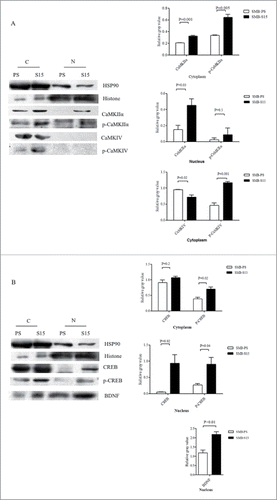
FIGURE 5. Analysis of the levels of CaMKs, p-CaMKs, CREB, p-CREB and BDNF in the fractions of the nucleus and cytoplasm of SMB cells. Western blots for CaMKIIα, p-CaMKIIα, CaMKIV and p-CaMKIV (A) as well as CREB, p-CREB and BDNF (B) in the fractions of the nucleus and cytoplasm of the cells. N: nucleus, C: cytoplasm. Various blots are shown on the left. Gray value analysis of the signals of CaMKs, p-CaMKs, CREB, p-CREB and BDNF in nucleus and cytosolic fractions are shown on the right. The quantitative results are collected from three independent experiments and are presented as mean+SD.

FIGURE 6. Increases of SNO-CaM and the related kinases in the brains of 263K-infected hamsters. A. The CaM-specific signals in the extracts of brain SNO proteins from three individual 263K-infected hamsters at terminal stage were comparatively evaluated with three normal ones. Graphical data are expressed as mean+SD. B. Dynamic alteration of SNO-CaM in the brains of 263K-infected hamsters during the incubation period. The extracts of brain SNO-proteins were pooled from the brains of three normal hamsters and 263K-infected hamsters collected 20, 40, 60 and 80 dpi. C. Western blots for SNO-CaMKs in the extracts of brain SNO-protein from three individual 263K-infected hamsters at moribund stage were comparatively analyzed with three normal ones. Graphical data are expressed as mean+SD. The relative gray values of CaM were normalized with that of the individual β-actin. D. Western blots for SNO-CaM in the extracts of SNO-protein from SMB-S15 and SMB-PS cells. The blot of SNO-CaM in the extract of brain SNO-protein from a 263K-infected hamster running in the same SDS-PAGE is used as control shown on the left.
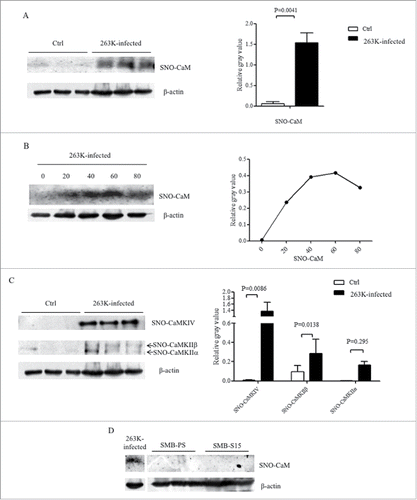
FIGURE 6. Increases of SNO-CaM and the related kinases in the brains of 263K-infected hamsters. A. The CaM-specific signals in the extracts of brain SNO proteins from three individual 263K-infected hamsters at terminal stage were comparatively evaluated with three normal ones. Graphical data are expressed as mean+SD. B. Dynamic alteration of SNO-CaM in the brains of 263K-infected hamsters during the incubation period. The extracts of brain SNO-proteins were pooled from the brains of three normal hamsters and 263K-infected hamsters collected 20, 40, 60 and 80 dpi. C. Western blots for SNO-CaMKs in the extracts of brain SNO-protein from three individual 263K-infected hamsters at moribund stage were comparatively analyzed with three normal ones. Graphical data are expressed as mean+SD. The relative gray values of CaM were normalized with that of the individual β-actin. D. Western blots for SNO-CaM in the extracts of SNO-protein from SMB-S15 and SMB-PS cells. The blot of SNO-CaM in the extract of brain SNO-protein from a 263K-infected hamster running in the same SDS-PAGE is used as control shown on the left.
Supplemental material

Supplemental_Material.zip

Download Zip (349.3 KB)

Reprints and Corporate Permissions

Please note: Selecting permissions does not provide access to the full text of the article, please see our help page How do I view content?

To request a reprint or corporate permissions for this article, please click on the relevant link below:

Academic Permissions

Please note: Selecting permissions does not provide access to the full text of the article, please see our help page How do I view content?

Obtain permissions instantly via Rightslink by clicking on the button below:

If you are unable to obtain permissions via Rightslink, please complete and submit this Permissions form. For more information, please visit our Permissions help page.