
Figures & data
FIGURE 1. Biochemical and biophysical characterization of purified Syrian Hamster recombinant prion protein (SHrPrP) (90–231 residues). (A) The top panel is the elution of rPrP using FPLC. The middle panel consists of total protein stain using Ponceau S solution. The bottom panel is the Western blot analysis of eluted rPrP using 6D11 antibody. The numbers 1–9 in the middle panel show samples loaded in each well during Western blot. Lane 1 represents molecular weight standards. Lanes 2–7 represent the protein fractions collected at different steps of protein purification. Lanes 5 & 7 (black lines) represent the early and late peak fractions, respectively, during elution of protein. Lane 6 (red line) represents the middle of the peak fraction of the eluted protein, which is used as a substrate in the RT-QuIC assay. Lane 8 represents the positive control, which is also an SHrPrP (90–231), from Dr. Caughey and colleagues, used as a reference. (B) Total protein stain (Ponceau S) and Western blot analysis of pooled SHrPrP (90–231) of purified protein and a positive control with the 6D11 antibody. The first lane is molecular weight standards, the second lane is purified protein and the third lane is a positive control. (C & D) NMR and CD spectroscopy images of SHrPrP (90–231). The blue line represents the SHrPrP (90–231) positive control purified at the Caughey lab, and the red line represents SHrPrP (90–231) that we purified. (E) AFR in the RT-QuIC assay using reference protein and purified protein as substrates. The blue bar indicates reference protein, while the red bar indicates purified protein.
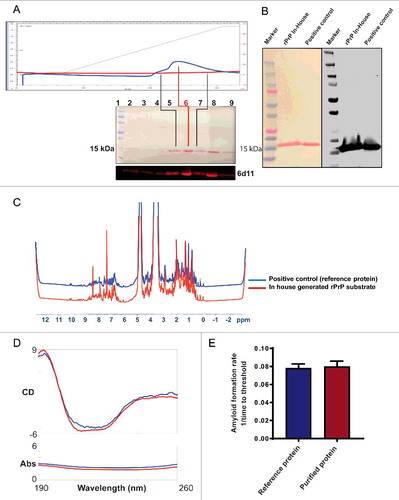
FIGURE 2. Choosing optimal working dilution and testing RAMALT samples in the RT-QuIC assay. (A) Different dilutions of a positive control on the RT-QuIC assay. Each dilution ran in triplicate. The 2 × 10⁻² dilution was used for all tested samples. (B) AFR for different dilutions of a positive control. The 2 × 10⁻² dilution has more AFR and is significantly different. Asterisks *p ≤ 0.05 and ***p < 0.001 added to show the sample concentrations that were significantly different. (C) Amplification kinetics of positive and negative elk RAMALT samples along with controls. Blue trace represents the RAMALT sample that tested positive in the RT-QuIC assay. (D) AFR of RAMALT sample along with a positive control. The blue bar indicates a representative trace of one RAMALT sample.
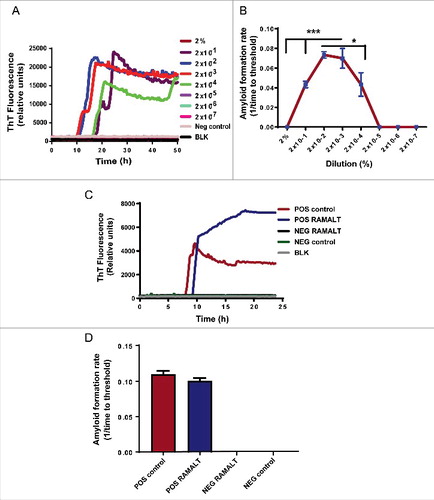
FIGURE 3. Isolation and immunohistochemical detection of PrPD from RAMALT sample. (A) Dissection of recto-anal mucosal (RA) junction to isolate mucosa-associated lymphoid tissue (MALT) for RAMALT sample. (B) Immunohistochemistry of RAMALT from elk (Cervus elaphus nelsoni). Note the proteinase-resistant prion staining (red chromogen) distribution within the lymphoid follicle located in the lamina propria. Staining was done using a mouse monoclonal antibody F99/97.6.1 against epitopes at residues 220–225 of prion protein and developed with streptavidin-alkaline phosphatase method. The slides were further counterstained with hematoxylin (blue stain).
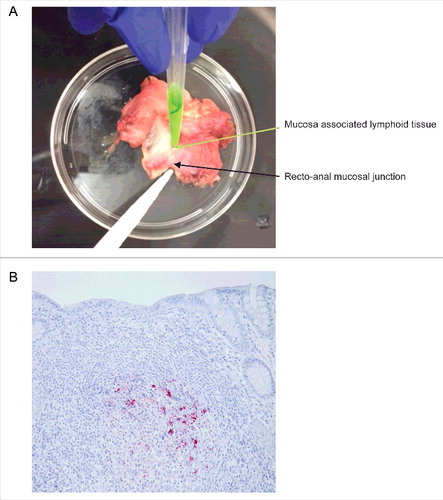
TABLE 1. Summary of CWD status by IHC and RT-QuIC assay results.
FIGURE 4. CWD status of the herd. (A) Stacked bar graph showing infectivity of different tissues from MM and ML genotypes at PrP codon 132. Red bars indicate the number of animals that are negative for CWD, while the blue bars indicate CWD-positive animals. (B) ROC curves of RAMALT RT-QuIC assay compared against other IHC tests. An AUC >90% indicates high accuracy. Among different IHC's, IHC of RAMALT has highest AUC which is 93.1%, indicating RAMALT RT-QuIC assay results were comparable to RAMALT IHC results.
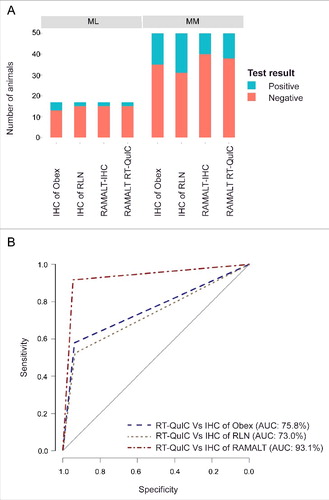
TABLE 2. Correlation between various tests.