Figures & data
Table 1. Clinicopathological findings of the six patients with V180I genetic Creutzfeldt–Jakob disease.
Table 2. Clinicopathological findings of the three patients with MM1 type and two patients with MM2C type sporadic Creutzfeldt–Jakob disease.
Figure 1. Macroscopic findings in patient 5. (A) the lateral aspect of the left cerebral hemisphere. The arrowhead indicates the central sulcus. (B) the left coronal section of the frontotemporal lobe through the anterior commissure from the posterior side. (C) the horizontal cut surface of the brainstem, from the left to the midbrain, pons, and medulla oblongata. (D) the sagittal division plane of the cerebellar vermis.
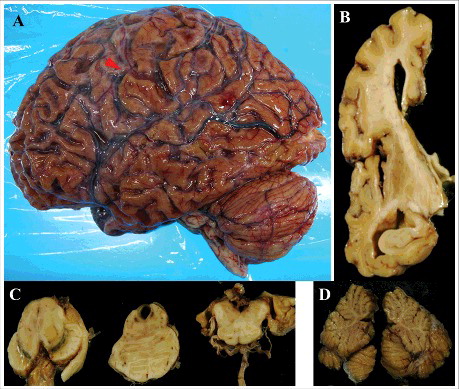
Figure 2. Microscopic findings of frontal lobe HE staining in patients with V180I genetic Creutzfeldt–Jakob disease (CJD) (A: patient 1, B: patient 2, C: patient 3, D: patient 4, E: patient 5, F: patient 6). Spongiform change is noted. However, neuronal loss and gliosis are mild compared to in sporadic CJD (MM1-type, MM2C-type). Even in patients 5 and 6, neurons remain. Scale bars: 100 μm HE, hematoxylin and eosin.
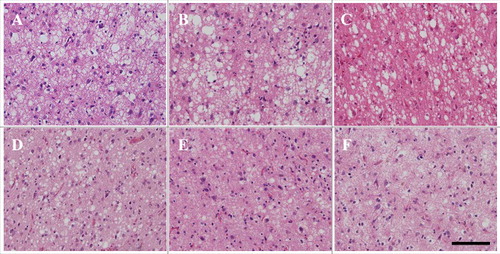
Table 3. The approximate degree of neocortical pathological findings in the six patients with V180I gCJD.
Figure 3. Microscopic findings of HE staining of the hippocampus (CA1) (A) and cerebellum (B) in patient 5. Mild neuronal loss, gliosis, and spongiform change are shown. Scale bars: 100 μm HE, hematoxylin and eosin.
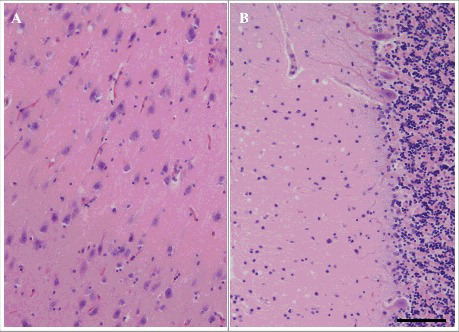
Figure 4. Microscopic findings of frontal lobe HE staining in patients 7–11 (A: patient 7, B: patient 8, C: patient 9, D: patient 10, E: patient 11). Fine vacuoles are observed in MM1-type sporadic Creutzfeldt–Jakob disease (sCJD) (A–C). Large confluent vacuoles are observed in MM2C-type sCJD (D, E). Scale bars: 100 μm HE, hematoxylin and eosin.
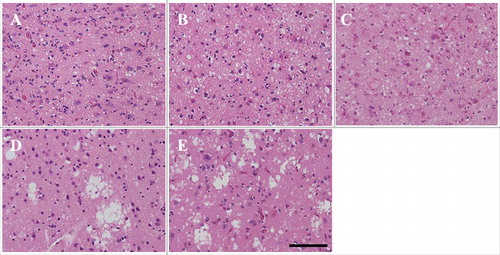
Table 4. The total number of vacuoles, mean vacuolar major diameter, and the coefficient of variation in all patients.
Figure 5. Comparison of vacuolar diameters in all patients with V180I genetic Creutzfeldt–Jakob disease (gCJD), and MM1-type and MM2C-type sporadic CJD by box-and-whisker plots of vacuole major diameter. The horizontal line inside each box indicates the median value, and the length of the box is the interquartile range (25th–75th percentile). The extremes of the whiskers contain 95% values. Open circles indicate outliers.