Figures & data
Figure 1. ME7-infected spleens at end-stage prion disease were smaller and have impaired T-zone structure and increased germinal center reactions. (A) Size and of (B) weight the spleens of control and ME7-infected mice at the end stage of prion disease. **, p < 0.01. (C) Confocal images of spleen sections from control and ME7-infected mice at the indicated times (130 and 200 days after injection). Immunofluorescent staining indicates CD3 (green, T cell marker) and IgM (red, B cell marker), and scale bar represents 100 μm. Yellow circles indicate germinal centers. N = 6 control and 6 ME7-infected mice.
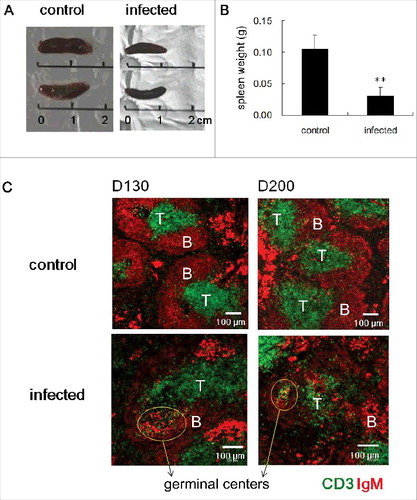
Figure 2. ME7-infected spleens at end-stage prion disease have larger FDC networks in germinal centers. Confocal images of ME7-infected mouse spleen sections 200 days after ME7 infection. Immunofluorescent staining indicates IgM (red), CD3 (blue), and FDC (green). (A, B, and C) Low-power confocal images of germinal centers. Scale bar represents 100 μm. (D) High-power confocal images of the area boxed in white in (C). Scale bar, 25 μm. N = 6 control and 6 ME7-infected mice.
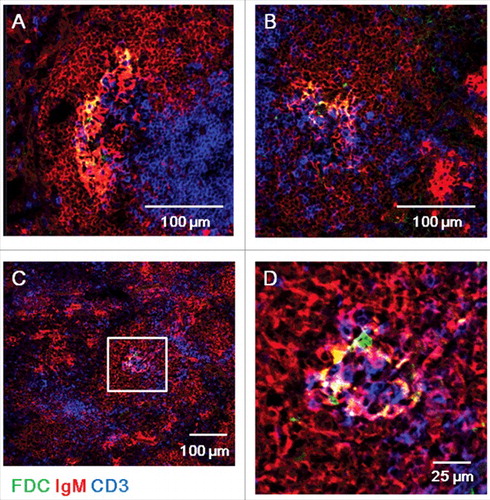
Figure 3. Tfh cell responses are increased in the spleens of ME7-infected mice. The mRNA expression levels of genes related to Tfh cell responses in the spleens of control and ME7-infected mice at the indicated times (50, 130, and 200 days after injection). (A) Bcl6, (B) Il21, (C) Il6, (D) Cxcr5, (E) Icos, (F) Pdcd1, (G) Tnfsf13b, (H) Tnfrsf13c, and (I) Cd40. Relative mRNA expression was measured by qRT-PCR and normalized to ActB signals. The data represent the average expression over six separate experiments, using six mice. Error bars represent mean values ± standard deviation. *, p < 0.05, and **, p < 0.01.
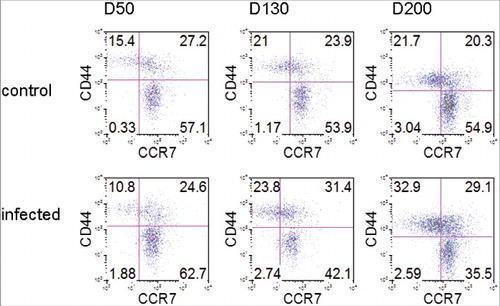
Figure 4. ME7 infections increases CD4 memory T cells. FACS analyses of CCR7 and CD44 expression by CD4+CD3+ gated cells in the spleens of control and ME7-infected mice after injection at the indicated times (50, 130, and 200 days after injection). The data represent the average expression over six separate experiments, using six mice.