Figures & data
Figure 1. Example pie chart of materials used in experiments described in the curated public articles. (A) All materials organized in this study were visualized. (B) Sub-pie chart of materials originated from mice. Click “Back to Materials” on the upper right panel of image to return to the original pie chart.
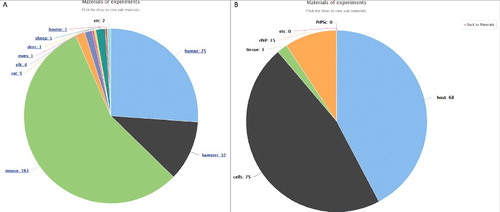
Figure 2. A tree map. Each branch of the tree is given as a rectangle, tiled with smaller rectangles representing sub-branches. Each branch indicates a relationship of small molecules to PrP and/or prion diseases progression. The first sub-branch provides small molecules included in each branch. The second sub-branch provides the PMID describing the role of each small molecule. (A) Two hundred eighty-three relationships between small molecules and PrP and/or prion diseases are shown. (B) Sub-tree map structure of PrPSc downregulation is shown.
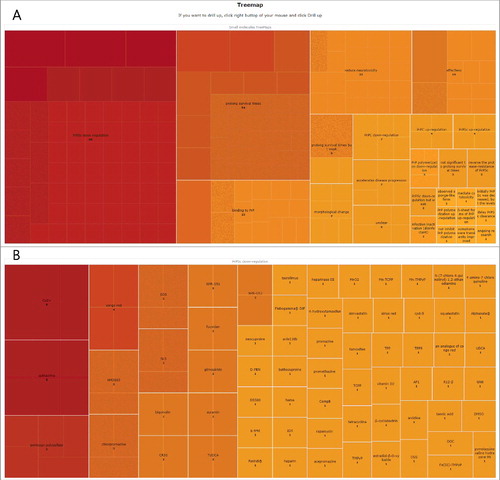
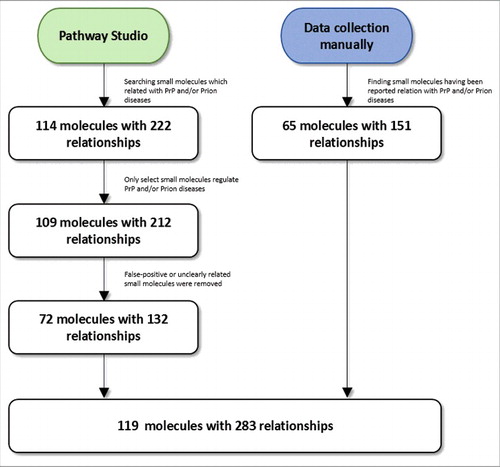
Figure 3. Process of searching small molecules related to PrP and/or prion diseases progression.