Figures & data
Figure 1. Differentiation of hDPSCs. (A) Morphology of hDPSCs from dental pulp untreated and treated with EGF/bFGF for 14 days. Scale bars, 50 μm. (B) Immunofluorescence analysis of neuronal marker β3-tubulin mAb expression. Scale bars, 50 μm.
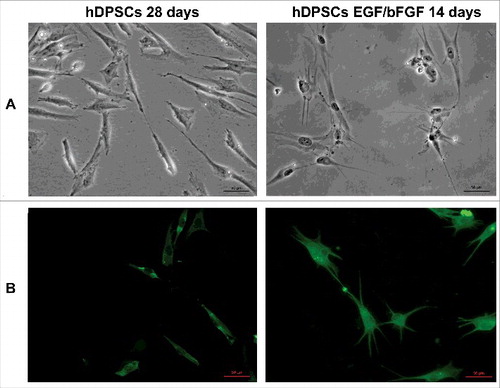
Figure 2. PrPC expression in hDSPCs. (A) Flow cytometry analysis of PrPC expression at 21 and 28 days from dental pulp separation and after additional 7 and 14 days with EGF/bFGF. Histograms represent log fluorescence vs cell number, gated on cell population of a side scatter/forward scatter (SS/FS) histogram. Cell number is indicated on the y-axis and fluorescence intensity is represented on the x-axis. Each panel was compared with the corresponding IgG negative isotype control. A representative experiment among 3 is shown. (B) Double staining flow cytometry analysis of PrP/CD44 in control hDPSCs (28 days from pulp separation) and PrP/ β3-tubulin after stimulation with EGF/bFGF for additional 14 days. Histograms represent log fluorescence PE vs log fluorescence CY5, gated on cell population of a side scatter/forward scatter (SS/FS) histogram. CD44-PE fluorescence is indicated on the y-axis and PrP-CY5 fluorescence intensity is represented on the x-axis. Each panel was compared with the corresponding IgG negative isotype control. A representative experiment among 3 is shown. (C) Western blot analysis of PrPC expression at 21 and 28 days from dental pulp separation and after additional 7 and 14 days with EGF/bFGF, using anti-PrP SAF32. Loading control was evaluated using anti-β-actin. Densitometric analysis of bands from the representative western blot is reported in panel on the right as Mean ± SD. (D) Immunofluorescence analysis of hDPSC untreated o treated with EGF/bFGF, using anti-PrP SAF32.
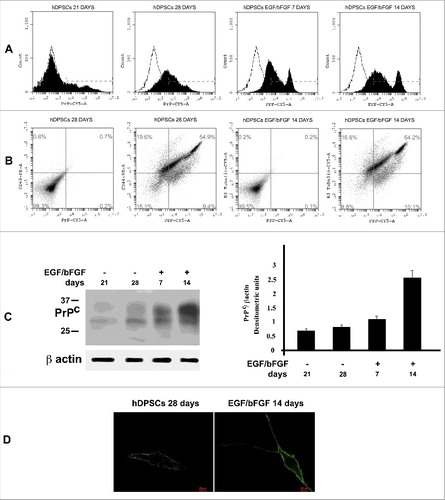
Figure 3. Analysis of PrPC association with gangliosides and EGF-R by coimmunoprecipitation. hDPSCs, untreated or treated with EGF/bFGF for 14 days, were lysed in lysis buffer, followed by immunoprecipitation with anti-PrP SAF32. A mouse IgG isotypic control was employed. The immunoprecipitates were spotted onto nitrocellulose, and incubated with anti-GM2 (A), anti-GD3 (B) and anti-EGF-R (C), as described in Materials and methods. A representative experiment among 3 is shown. Bar graph in the right panel shows densitometric analysis. Results represent the Mean ± SD from 3 independent experiments, *p < 0.01. The immunoprecipitates were checked using the anti-PrP 6H4 (D).
Figure 4. Effects of PrPC silencing on ERK and Akt phosphorylation induced by EGF. hDPSCs, untreated or treated with 20 ng/ml EGF, in the presence or in the absence of pre-treatment with siRNA PrP or scrambled siRNA, were analyzed by Western blot, using anti-pERK1/2, anti-total ERK1/2 (A), anti-pAkt and anti-total Akt (B), Densitometric analysis is shown in the right. Results represent the Mean ± SD from 3 independent experiments, *p <0.01 siRNA PrP treated cells vs EGF treated cells. As control, scrambled siRNA was employed in each experiment.
Figure 5. Plasma membrane PrPC is required for signal transduction. hDPSCs cells, treated with siRNA PrP or scrambled for 72 hours, were stimulated with anti PrP SAF61 mAb for 10 min and analyzed by Western blot, using anti-pERK1/2, anti-total ERK1/2 (A), anti-pAkt, and anti-total Akt (B). Densitometric analysis is shown in the right panel. Results represent the Mean±SD from 3 independent experiments, *p <0.01 siRNA PrP treated cells vs SAF61 treated cells.
Figure 6. Role of PrPC during neuronal differentiation of hDPSCs induced by EGF/bFGF. (A) Flow cytometry analysis of PrPC expression in hDPSCs, untreated or treated with siRNA PrP for 72 hours. Histograms represent log fluorescence vs cell number, gated on cell population of a side scatter/forward scatter (SS/FS) histogram. Cell number is indicated on the y-axis and fluorescence intensity is represented on the x-axis. Each panel was compared with the corresponding IgG negative isotype control. A representative experiment among 3 is shown. (B-C) Western blot analysis of β3-tubulin, and NFH expression in hDPSCs, untreated or treated with 20 ng/ml EGF and 40 ng/ml bFGF for 14 days, in the presence or in the absence of pre-treatment with siRNA PrP or scrambled siRNA for 72 hours. Densitometric analysis is shown in the right panel. Results represent the Mean±SD from 3 independent experiments. *p <0.01 siRNAPrP treated cells vs EGF/bFGF treated cells.