Figures & data
Figure 1. Western blot and PMCA analysis. (A) Ten % brain homogenates (BH) collected from Pin1+/+, Pin1+/− and Pin1−/− mice were analyzed by means of Western blot and showed similar levels of PrPC expression. Densitometric analysis confirmed the lack of statistically significant differences (t-test). Graphs represent the mean and bars indicate Standard Error of the Mean (SEM). (B) RML prion strain was spiked (from 10−5 to 10−9) in Pin1+/+, Pin1+/− or Pin1−/− BH and subjected to PMCA analysis. The amplification efficiency of RML was similar in all groups of mice and enable detection of all dilutions after one round of PMCA. Samples were immunoblotted with the 6D11 antibody after PK digestion. PrPC refers to normal mouse brain homogenate not digested with PK. Numbers in the left of the Western blot indicate molecular weight markers.
Table 1. Summary of the inoculation and main clinical findings in Pin1+/+, Pin1+/− and Pin1−/− mice. This table summarizes the experimental groups of animals challenged with RML or Mock. Attack rate, incubation and survival times (Mean ± SEM) of injected mice are reported.
Figure 2. Effect of different Pin1 expression levels on incubation time, survival time and spongiform changes of RML injected mice. (A) Incubation time (period between prion inoculation and the appearance of clinical signs) and survival time (period between inoculation and the day of sacrifice) were not statistically different (Logrank test) between groups of RML injected animals. (B) The lesion profiles were determined on H&E stained sections, by scoring the vacuolar changes in nine standard brain regions: 1 = dorsal medulla, 2 = cerebellar cortex, 3 = superior colliculus, 4 = hypotalamus, 5 = thalamus, 6 = hippocampus, 7 = septum, 8 = retrosplenial and adjacent motor cortex, 9 = cingulated and adjacent motor cortex. Double-tailed unpaired t-test (Mann-Whitney test) confirmed that these differences did not reach statistical significance.
Figure 3. Neuropathological and biochemical analysis. (A) Immunohistochemical analysis showed no differences in PK-resistant PrP deposition throughout the brain of RML injected animals. Representative pictures of hippocampus and thalamus belonging to RML or mock injected mice are shown. As expected, no PK-resistant PrP deposits were found in the brain of mock injected animals. Sections were immunostained with the 6H4 antibody after PK digestion. Scale bar related to all hippocampal pictures: 60 µm. Scale bar related to all thalamic pictures: 40 µm. (B) Biochemical analysis showed similar amount of PrPres accumulation in the brain of all RML injected mice. Samples were immunoblotted with the 6D11 antibody after PK digestion. Densitometric analysis confirmed the lack of statistically significant differences (t-test). Graphs indicate the mean while bars represent SEM.
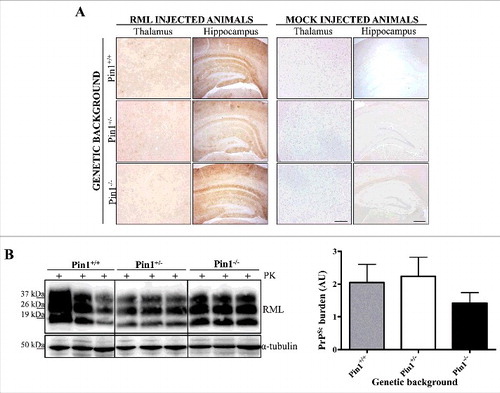
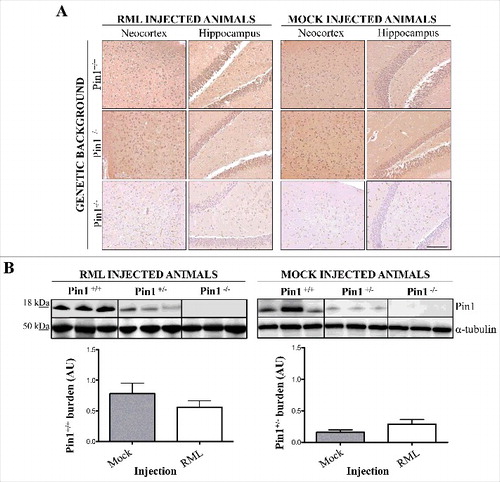
Figure 4. Neuropathological and biochemical analysis of Pin1 expression. (A) Immunohistochemical analysis showed similar Pin1 immunoreactivity in the brain of Pin1+/+ and Pin1+/− animals injected with RML or mock. Representative pictures of neocortex and hippocampus are shown. No signal was detected in the brain of Pin1−/− animals. Scale bar, 10 µm. (B) Biochemical and densitometric analysis confirmed the lack of statistically significant differences in the total expression level of Pin1 in RML or mock injected (Pin1+/+ and Pin1+/−) mice (t-test). Graphs indicate the mean while bars represent SEM.