Figures & data
Figure 1. Network showing relationships among haplotypes of PRNP. Each circle represents a distinct haplotype sequence, designated A through Z, with circle sizes proportional to the frequency of the haplotypes among white-tailed deer. Each line indicates a single nucleotide difference separating two haplotypes (there were no cases where the line depicted represented more than a single nucleotide difference). Haplotypes that share the same color have the same inferred amino acid residues for the portion of the coding region sequenced (and thus are separated only by synonymous difference). The haplotypes protective against CWD are identified using a dashed circle. Interestingly, each of the two protective haplotypes (C in blue and F in orange) had a different amino acid sequence than the other major haplotypes (A through H, exclusive of C and F) and from each other. The haplotypes depicted in white each had a distinct amino acid sequence from every other haplotype.
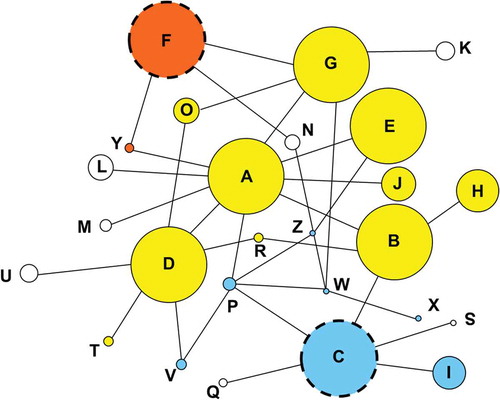
Table 1. PRNP haplotype frequencies and association with CWD infection.
Figure 2. CWD status in white-tailed deer by PRNP haplotype. Each haplotype is listed along the x-axis, while the y-axis indicates number of chromosomes. Within each bar, the shaded region represents CWD positive deer, while the unshaded region represents CWD negative deer. Asterisks indicate those haplotypes (C and F) associated with a statistically significant reduction in CWD cases when compared to Haplotype A. Unphased sequences of PRNP were generated for 2282 deer; for an alignment of these sequences, the software PHASE v2.1 was used to identify phased haplotype sequences (2N = 4564 chromosomes). For each homozygous deer, two was added to the chromosome number for the appropriate haplotype, while one was added to each relevant haplotype for heterozygous deer.
Table 2. Proportion of protective haplotypes by county FY2003-2015.
Table 3. Proportion of protective haplotypes by TRS category per county.
Table 4. Proportion of protective haplotypes by TRS category per region in Illinois.
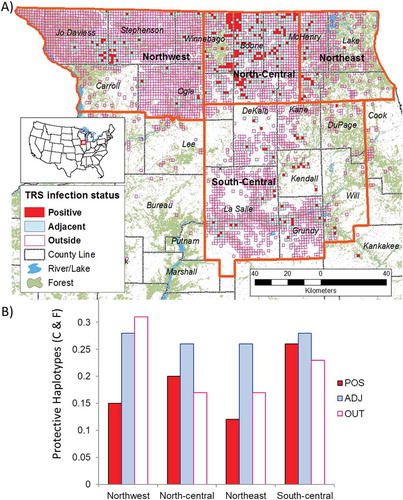
Figure 3. Map of northern Illinois CWD infection distribution. (A) Orange lines indicate region boundaries guided by genetic population structure determined by Kelly et al. 2014. Each TRS tested for CWD between 2002 and 2015 is color coded based on the cumulative results from the Illinois Department of Natural Resources Chronic Wasting Disease Surveillance and Management program: (red, POS) at least one confirmed case of CWD, (blue, ADJ) no infected deer but a detection within a TRS less than 100 meters away, or (purple outline, OUT) no infected deer detected and more than 100 meters from an infected TRS. (B) Frequency of protective haplotypes within each region among TRS categories.