Figures & data
Table 1. Demographic data with the results of genetic testing and the presence of protein 14–3–3 in CSF for gCJD cases with insomnia (Group I) and without insomnia (Group II).
Figure 1. Frequency of early symptoms of gCJD cases with insomnia (Group I) and without insomnia (Group II).
Figure 2. Localization of MRI (T2 and DWI sequences) and type of EEG changes in gCJD cases with insomnia (Group I) and without insomnia (Group II). (gPSWC – Generalized Periodic Sharp Wave Complexes, lPSWC – Lateralized Periodic Sharp Wave Complexes).
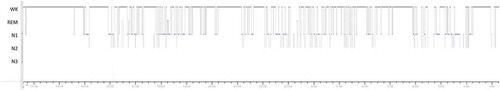
Figure 3. Hypnogram of a 51-year-old male familial gCJD E200K patient with prominent insomnia; monitoring was set approx. 8 months after the onset of insomnia and depressive symptoms. It shows fragmented night sleep shifting between NREM 1 (N1), NREM 2 (N2) and Wakefulness (WK) and the intrusion of sleep into the wakefulness.