2,035
Views
8
CrossRef citations to date
0
Altmetric
Research paper

Use of faecal volatile organic compound analysis for ante-mortem discrimination between CWD-positive, -negative exposed, and -known negative white-tailed deer (Odocoileus virginianus)

ORCID Icon, , , &
Pages 94-105 | Received 31 Aug 2018, Accepted 04 Apr 2019, Published online: 28 Apr 2019

Figures & data

Table 1. Linear Discriminant Analysis Classification Models of CWD positive and negative deer.

Table 2. Tentative identification of seven peaks used to discriminate between CWD-positive, -negative exposed, and -negative deer.

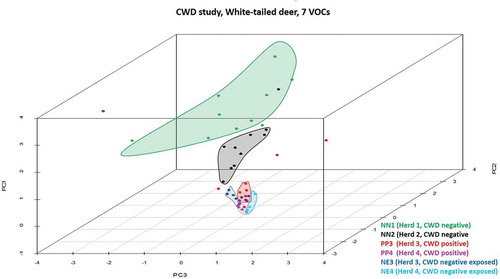
Figure 1. Three-dimensional PCA scatterplot of CWD-positive, -negative exposed, and -negative deer. All known negative animals from Herd 1 (NN1; green dots) and one from Herd 2 (NN2, black dot) are located in a cluster (green) closely associated with all other NN2 individuals (black cluster). Three Herd 3 CWD-positive (PP3, red dots) and one -negative exposed individual (NE3, blue dot) are not associated with clusters in the plot and represent outliers. Remaining PP3 and NE3 animals and Herd 4 (PP4, pink dots; NE4, aqua dots) animals form closely associated clusters, with the exception of four NE3 animals found within or in close association to the PP3 cluster.

Figure 1. Three-dimensional PCA scatterplot of CWD-positive, -negative exposed, and -negative deer. All known negative animals from Herd 1 (NN1; green dots) and one from Herd 2 (NN2, black dot) are located in a cluster (green) closely associated with all other NN2 individuals (black cluster). Three Herd 3 CWD-positive (PP3, red dots) and one -negative exposed individual (NE3, blue dot) are not associated with clusters in the plot and represent outliers. Remaining PP3 and NE3 animals and Herd 4 (PP4, pink dots; NE4, aqua dots) animals form closely associated clusters, with the exception of four NE3 animals found within or in close association to the PP3 cluster.

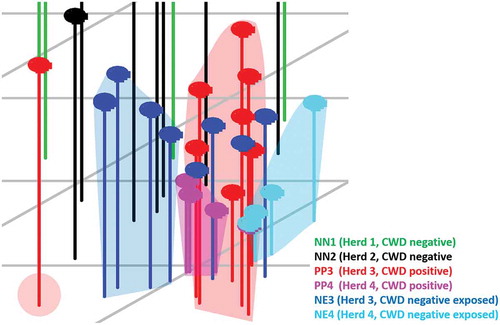
Figure 2. Enlarged view of the area in the PCA scatterplot area containing Herd 3 and 4 CWD-positive and -negative exposed animals. CWD-positive animals from Herd 3 (PP3, red dots) form a distinct cluster containing three negative exposed animals (NE3) from that herd. Remaining NE3 animals form a distinct cluster with the exception of one individual found adjacent to the PP3 cluster. Herd 4 CWD-positive (PP4; pink dots) and -negative exposed (NE4; aqua dots) animals form separate clusters. The close approximation of these clusters indicates that there are some distinct similarities between the cohorts, yet differences between the groups do exist. The three NE3 animals located within the PP3 cluster, and the one NE3 individual located near that cluster may represent animals that were incorrectly classified by our analysis, or may be positive animals infected with a prion burden so low that prion was not detected in the post-mortem IHC analysis performed on the submitted tissues.

Figure 2. Enlarged view of the area in the PCA scatterplot area containing Herd 3 and 4 CWD-positive and -negative exposed animals. CWD-positive animals from Herd 3 (PP3, red dots) form a distinct cluster containing three negative exposed animals (NE3) from that herd. Remaining NE3 animals form a distinct cluster with the exception of one individual found adjacent to the PP3 cluster. Herd 4 CWD-positive (PP4; pink dots) and -negative exposed (NE4; aqua dots) animals form separate clusters. The close approximation of these clusters indicates that there are some distinct similarities between the cohorts, yet differences between the groups do exist. The three NE3 animals located within the PP3 cluster, and the one NE3 individual located near that cluster may represent animals that were incorrectly classified by our analysis, or may be positive animals infected with a prion burden so low that prion was not detected in the post-mortem IHC analysis performed on the submitted tissues.

Table 3. Potential sources of tentatively identified volatile organic compounds used to discriminate between CWD positive and negative deer.

Table 4. Comparison of CWD assay sensitivities (SN) and specificities (SP).

Table 5. Herd identification, animal classification, CWD status, and the number of animals from each sample group used in the study.