
Figures & data
Table 1. Patients’ classification and clinical features of the definite, probable, possible CJD cases and other neuronal diseases patients used in this study.
Table 2. Diagnostic performance of various cerebrospinal fluid markers for Creutzfeldt-Jakob disease according to defined criteria.
Figure 1. Heat map of the correlation of t-tau, p-tau, p/t-tau ratio, Aβ, a-syn and 14–3-3 levels with patients. The colour of each square depicts the correlation level, ranging from black (negative correlation) to red (intermediate correlation value) to white (positive correlation value).
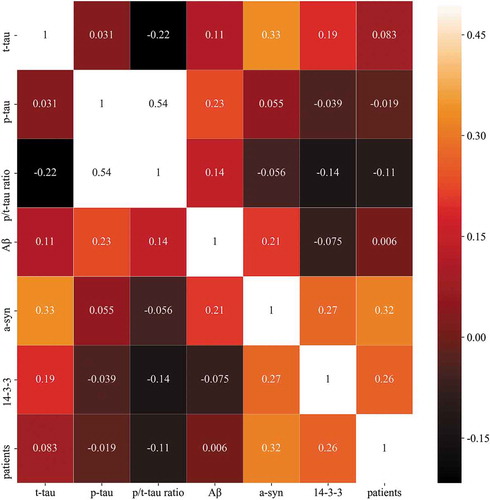
Figure 2. Discrimination plot for discrimination between CJD (orange) and non-CJD (blue) patients based on values of six CSF biomarkers.
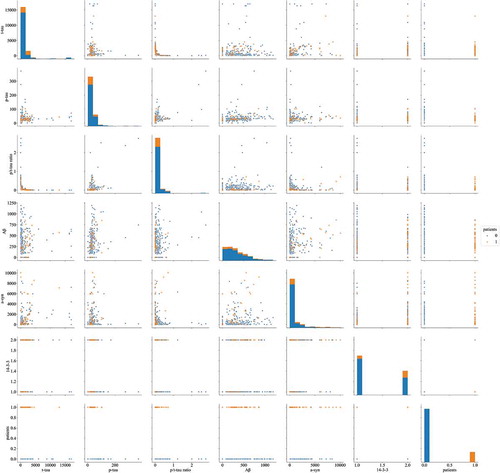
Table 3. Evaluation of classifier performances (test set_A, 12 of CJD cases and 40 of non-CJD patients).
Figure 3. Deep neural network showing the best performance for CJD discrimination. Our network structure consisted of one input, five hidden, and one output layer. The five hidden layers consisted of 20, 40, 30, 20, and 12 hidden unit numbers of each layer, respectively. The last two output units were used to distinguish between CJD and non-CJD patients.
Table 4. Analysis of two- and three-protein combinations for discrimination between CJD and non-CJD patients. All values were calculated using the oversampled validation set and test set_A.