Figures & data
Figure 1. MRI-DWI (left), ADC-map (middle) and 18F-FDG-PET (right) imaging of parietooccipital cortex. MRI imaging showed hyperintense signals in the left occipitoparietal cortex in diffusion-weighted imaging with correlating hypointense signals in the ADC-map. The same area presents hypometabolic in 18F-FDG-PET imaging
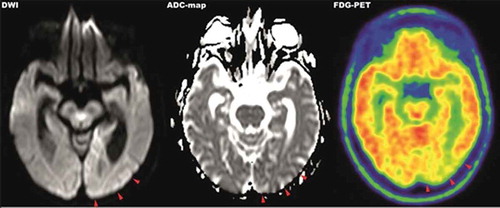
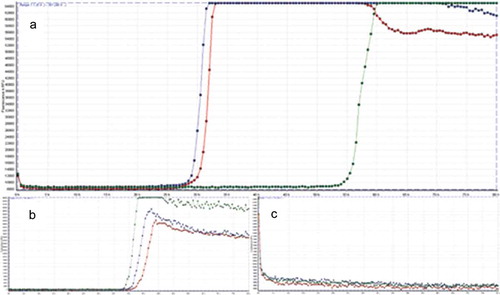
Figure 2. Result of the RT-QuIC assay. All graphs display fluorescence intensity in relative fluorescence units (RFU) on vertical over horizontal time axis in hours. RT-QuIC of patient samples is displayed in graph A, graph B shows the curve of the positive control and graph C of the negative control, respectively. An increase of fluorescence during reaction above the cut-off of 10,000 RFU is considered a positive result