Figures & data
Figure 1. SDD-AGE can be used for quantitative analysis of aggregate molecular weights, but electrophoresis artefacts can make the results irreproducible. (a) The estimated median molecular weights of Sup35 aggregates in OT55 and GT488 (weak [PSI+]), as well as OT56 and GT490 (strong [PSI+]) yeast strains, demonstrate that the method can be used to compare aggregate sizes. ‘W’ and ‘S’ stand for weak and strong prion variants. (b) Representative images of SDD-AGE blots. The anti-Sup35 antibody was used. (c) Estimates of Sup35 aggregate sizes for two independent runs of different lysates of the OT55 (weak [PSI+]) and OT56 (strong [PSI+]) strains. Ld stands for the lane with DNA ladder. (d) Representative SDD-AGE images. Different dot shapes on the plots correspond to independent experiments. Additional lanes were removed for clarity (b, d). *, p < 0.05; **, p < 0.01; ***, p < 0.001, Mann-Whitney rank sum test, FDR-corrected)
![Figure 1. SDD-AGE can be used for quantitative analysis of aggregate molecular weights, but electrophoresis artefacts can make the results irreproducible. (a) The estimated median molecular weights of Sup35 aggregates in OT55 and GT488 (weak [PSI+]), as well as OT56 and GT490 (strong [PSI+]) yeast strains, demonstrate that the method can be used to compare aggregate sizes. ‘W’ and ‘S’ stand for weak and strong prion variants. (b) Representative images of SDD-AGE blots. The anti-Sup35 antibody was used. (c) Estimates of Sup35 aggregate sizes for two independent runs of different lysates of the OT55 (weak [PSI+]) and OT56 (strong [PSI+]) strains. Ld stands for the lane with DNA ladder. (d) Representative SDD-AGE images. Different dot shapes on the plots correspond to independent experiments. Additional lanes were removed for clarity (b, d). *, p < 0.05; **, p < 0.01; ***, p < 0.001, Mann-Whitney rank sum test, FDR-corrected)](/cms/asset/12a62e98-3a98-4899-8b9a-d0bb79ef6800/kprn_a_1751574_f0001_b.gif)
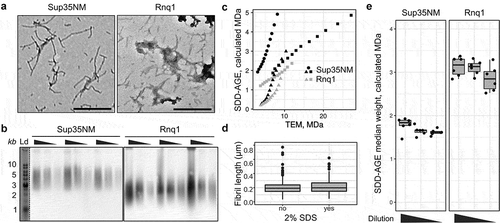
Figure 2. SDD-AGE-based estimates differ from the corresponding measurements based on the TEM data. (a) TEM images of Sup35NM and Rnq1 fibrils. The scale bar equals 500 nm. (b) SDD-AGE results for the same samples from panel A. The 3-fold serial dilutions were analysed. The anti-His antibody was used. ‘Ld’ corresponds to DNA ladder. (c) Quantile-quantile plots of aggregate molecular weights calculated with different methods. Percentiles from 20 to 80 in increments of 5 are plotted. Different dot shapes on the plots correspond to independent experiments. Different proteins are marked with colour (black for Sup35NM and grey for Rnq1). (d) The distributions of Rnq1 fibril lengths in samples with or without SDS. At least 250 fibrils were measured in each case. (e) The estimated median molecular weights of Rnq1 and Sup35NM fibrils computed using samples without or with 3-fold and 9-fold dilution. The corresponding raw results of SDD-AGE are shown in (b)

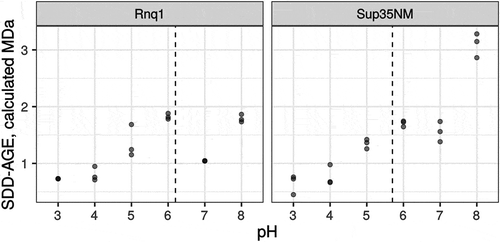
Figure 3. pH of the running buffer affects the mobility of amyloid aggregates. Each dot corresponds to the median molecular weight of Rnq1 or Sup35NM fibrils obtained in vitro estimated with SDD-AGE in running buffers with the respective pH. Results of 3 replicate runs are shown. Dashed lines correspond to isoelectric points of proteins

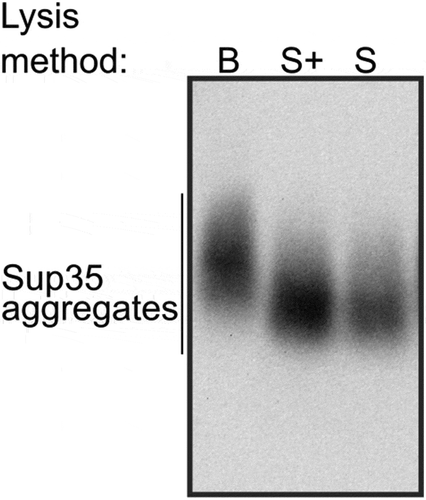
Figure 4. Optimization of spheroplast lysis. (a) The comparison of the protein extraction methods before (left) and after (right) optimization of spheroplast lysis. Zymolyase 20T and lyticase 2M (indicated as Z and L, respectively) were used for spheroplasting to create images in the left and right parts of the panel, respectively. The anti-Sup35 antibody was used. (b) Dynamics of spheroplasting measured by OD. (c-e) Analysis of protein extracts at different time points. Panels (a)and (c)show SDD-AGE results, panel (d)shows a Coomassie R250 stained polyacrylamide gel, and E shows Western blotting after SDS-PAGE. The extracts of the OT56 strain were used in panels (a)and (c-e)


