Figures & data
Table 1. Characteristics of the software used for identification of amyloidogenic regions and results of prediction for A and B chains of insulin, lispro, and glargine.
Figure 1. Normalized ThT fluorescence data for lag-time of the initial stage of insulin, lispro and glargine aggregation at a concentration of 2 mg/ml (a). Results are averages of three replicates per insulin type. Electron microscopic images obtained fibrils after 2880 min (48 hours) of incubation at 37°C (b). Preparations of insulin and its analogues were solved in 140 mM NaCl containing 20% (v/v) acetic acid (рН 2.0).
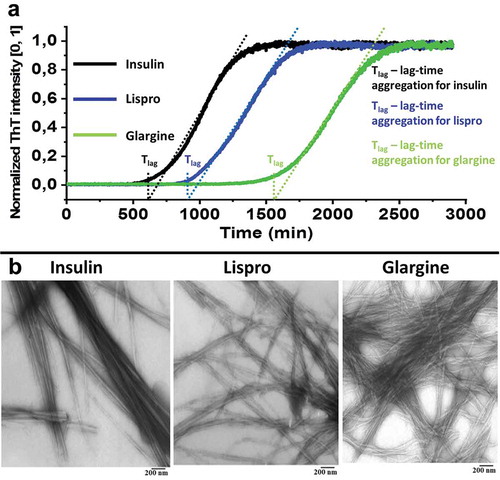
Figure 2. Chromatograms (left) and panoramic mass spectra (right) of hydrolyzates of insulin (a), lispro (b), and glargine (c) fibrils obtained at the proteases to protein ratio 1:25, w/w. The retention time for the mass spectra of fibrils hydrolyzates is 68.44 min.
Figure 3. Chromatograms (left) and panoramic mass spectra (right) of hydrolyzates containing no fibrils of insulin (a), lispro (b), and glargine (c) solutions obtained at the proteinases to protein ratio 1:25, w/w. The retention time for the mass spectra of proteins hydrolyzates is 68.44 min.
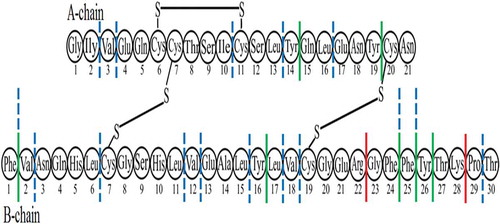
Figure 4. Scheme plotted using the results of identification of amyloidogenic regions in the spine of insulin (a), lispro (b), and glargine (c) fibrils. The putative spine of fibril is shown by dashed lines. Coloured ovals show a.a. modifications of lispro and glargine.
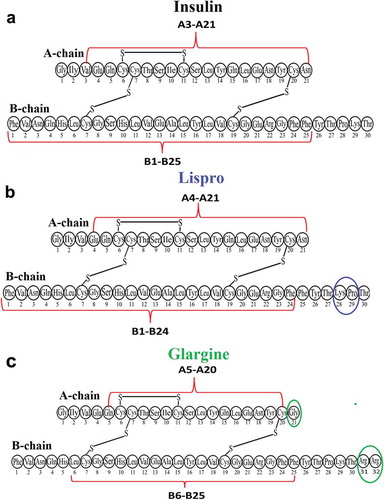
Figure 5. Potential sites of hydrolysis of peptide bonds in the lispro monomer with three proteases. Red lines show bonds specifically hydrolysed with trypsin. Green lines indicate the bonds specifically hydrolysed with chymotrypsin. Blue dash-and-dot lines show sites of predominant peptide bond cleavage with proteinase K.