Figures & data
Table 1. Polymorphic sites within the coding region of PRNP in 2899 WTD collected from 2002 to 2017 in Illinois and Wisconsin, and haplotype frequencies for the 2754 CWD tested deer.
Table 2. Amino acid variation in WTD prion protein.
Figure 1. PRNP haplotype frequencies for deer collected between 2002 and 2017 and tested for CWD. Pie charts show frequencies for CWD negative (left) and positive (right) deer that carried PRNP haplotypes A through G. Haplotypes are coloured and arranged based on the encoded protein variants. Haplotypes B, D, E, and G were synonymous to haplotype A and shown in yellow (PrP variant A), haplotype C is in blue (PrP variant C), haplotype F is in orange (PrP variant F). The reduced frequency of PrP variants C and F in positive deer is evident. Rare haplotypes with frequencies <0.01 are not shown.
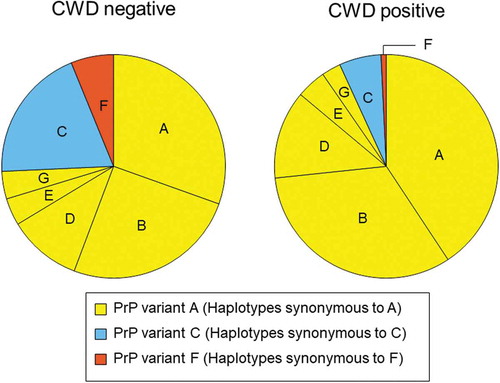
Figure 2. PrP variants and CWD susceptibility, for PrP variants A, C, and F. Only the samples collected after CWD spread to each county and that did not encode uncommon protein variants were used (n = 2376). Light shading indicates CWD negative and darker shading indicates CWD positive cases. PrP variant A was detected significantly more frequently than PrP variant C (OR = 0.26) or PrP variant F (OR = 0.10) in CWD positive deer than in CWD negative deer. PrP variant C showed a significantly smaller relative reduction than PrP variant F in CWD positive samples (OR = 0.37). For each protein variant, deer with one chromosome encoding the variant added one to the total shown, while deer with both chromosomes encoding a variant added two to the total; p-values are based on Fisher’s exact tests (two-tailed) and adjusted using the Benjamini-Hochberg procedure.
Figure 3. PrP variant combinations in CWD positive and negative deer. Combinations of protein variants are colour-coded; deer with both chromosomes encoding PrP variant A (AA) are shown in yellow, deer with PrP variant C encoded by at least one chromosome are shown in blue (AC or CC), deer with PrP variant F encoded by at least one chromosome are shown in orange (AF or FF), deer with one chromosome encoding PrP variant C and the other encoding F are shown in purple (CF), and deer with other protein variants encoded by at least one chromosome are in white (others). The much higher proportion of AA relative to other combinations is evident among CWD positive relative to CWD negative deer. No FF or CF deer were detected among CWD positive deer.
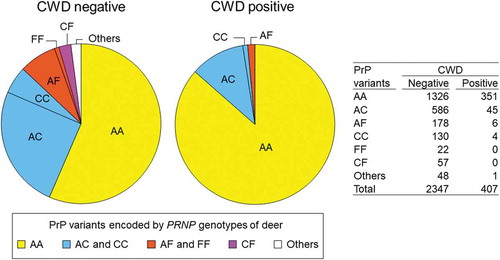
Figure 4. PrP variant combinations and CWD susceptibility. Only the samples collected after CWD spread to each county and that did not carry uncommon protein variants were used (n = 2376). (a) Samples were grouped into deer with two chromosomes encoding PrP variant A (AA), deer with one chromosome encoding PrP variant A (AC and AF), and deer without PrP variant A (CC, FF, CF). Deer with both chromosomes encoding PrP variant A showed a significantly higher susceptibility to CWD compared to deer that carried only 1 chromosome encoding PrP variant A (AC or AF) (OR = 0.25), or to deer that did not carry any chromosomes encoding PrP variant A (CC, FF, or CF) (OR = 0.07). Deer with no chromosomes encoding PrP variant A (CC, FF, or CF) showed significantly reduced susceptibility to CWD compared to deer that encoded PrP variant A in just one chromosome (AC or AF) (OR = 0.28). The p-values are based on Fisher’s exact tests (two-tailed) and adjusted using the Benjamini-Hochberg procedure. (b) CWD positive and negative deer numbers are shown in a histogram for each protein variant combination: AA, AC, AF, CC, FF, and CF. The association between each PrP variant combination and CWD susceptibility was tested with Fisher’s exact test (two-tailed). The upper right table shows the p-value (above diagonal) and odds ratio (below diagonal) for each comparison. NS indicates that the p-value that was more than 0.10 and NA indicates not applicable, because CWD was not detected for deer encoding FF or CF. Shading indicates significant results after the Benjamini-Hochberg procedure was applied.