Figures & data
Figure 1. Biochemical analysis of STXBP1 aggregation in rat brain. (a) Size fractionation of rat brain lysate. Total lysate was divided into monomers (less than 100 kDa), oligomers (larger than 100 kDa), and insoluble aggregates. The fractions were separated by SDS-PAGE and analysed by Western-blotting using anti-STXBP1 antibodies. (b) Relative intensity of bands related to STXBP1 monomers, oligomers and aggregates. STXBP is mostly presented in oligomer and polymer fractions. Intensities are represented as mean ± SEM (with three independent brain samples). (c) SDD-AGE of protein lysates extracted from rat brain. Total rat brain lysate was treated with 1% SDS at room temperature (SD) or with 2% SDS at 95°C (d) and subjected to SDD-AGE with subsequent immunoblotting with anti STXBP1 antibodies
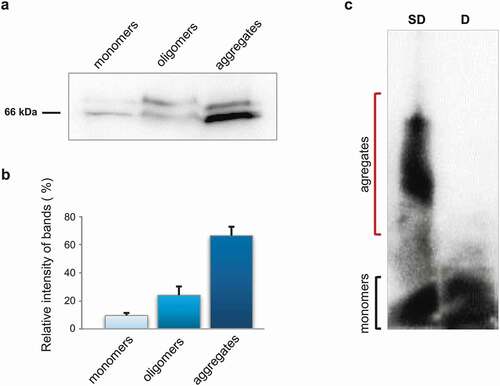
Figure 2. Analysis of amyloid properties of STXBP1 immunoprecipitated from rat brain. The STXBP1 protein which was extracted from rat brain binds Congo red (a) and demonstrates yellow-green birefringence under polarized light (b). Scale bar, 20 μM (c) Fibrils of STXBP1 extracted from rat brain using immunoprecipitation visualized by TEM. Scale bar, 200 nm
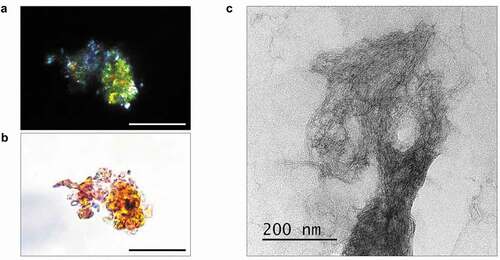
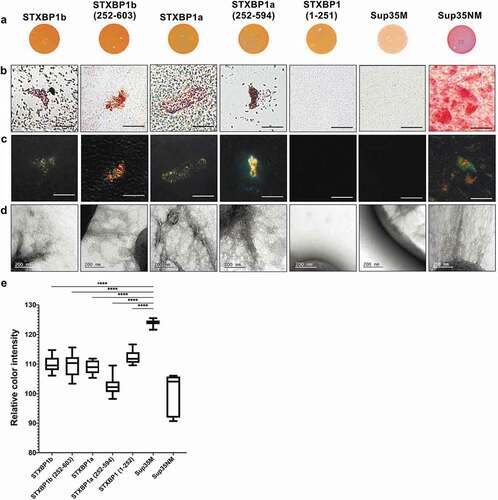
Figure 3. Analysis of amyloid properties of CsgAss-STXBP1a, CsgAss-STXBP1b, CsgAss-STXBP1a(252–594), CsgAss-STXBP1b(252–603), CsgAss-STXBP1(1–251), CsgAss-Sup35M and CsgAss-Sup35NM proteins in C-DAG bacterial system. (a) Colony colour assay of bacteria plated on CR containing medium. CsgAss-Sup35NM so as all CsgAss-STXBP1 forms bind CR. (b, c) Analysis of scraped samples of bacteria grown on CR-comprising medium using polarization microscopy: (b) bright field, (c) crossed polarizers. CsgAss-STXBP1a, CsgAss-STXBP1b, CsgAss-STXBP1a(252–594), CsgAss-STXBP1b(252–603) and CsgAss-Sup35NM bind CR and demonstrate apple-green birefringence when examined between crossed polarizers. Scale bar, 20 μM. (d) Analysis of scraped samples of bacteria using transmission electron microscopy. CsgAss-STXBP1a, CsgAss-STXBP1b, CsgAss-STXBP1a(252–594), CsgAss-STXBP1b(252–603) and CsgAss-Sup35NM form fibrils detectable by TEM. The cultures producing the CsgAss-Sup35NM and CsgAss-Sup35M proteins were taken as positive and negative controls, respectively. (e) Relative colour intensity of bacterial colonies grown on Congo red medium is represented as mean ± SEM. All protein variants are significantly different compared to the negative control. Relative quantification was determined by ImageJ. Statistical analysis was performed using unpaired t test (* p < 0.1, ** p < 0.01, *** p < 0.001, **** p < 0.0001) by Prism