Figures & data
Figure 1. Current state of AD diagnostics using biomarkers. AD biomarkers are grouped and marked as it is proposed by Jack et al. [Citation6] as reflecting different sides of AD pathological process. A – biomarkers related to Aβ pathology (CSF Aβ42, CSF Aβ42/Aβ40 ratio and Aβ plaques measured by PiB-PET); T – biomarkers related to tau pathology (CSF P-tau and tau tangles measured my PET); (n) – biomarkers of neurodegeneration (synaptic dysfunction measured by FGD-PET, CSF T-tau and brain structure analysed by MRI); (c) – cognitive symptoms (mild cognitive impairment at prodromal stage and clinical dysfunction at dementia). Similar to (N), (C) can have a background other than AD and thus placed in parentheses. Despite cognitive syndromes are the consequences of neurodegeneration, (C) is placed on the top of this scheme as nowadays AD diagnostics begins from the recognition of cognitive changes, when the patient is suspected to be already in the prodromal stage of the disease. Further analysis of core AD biomarkers from A and T blocks confirms or rejects the diagnosis, whereas (N) biomarkers level help to estimate the degree of degenerative processes in CNS
![Figure 1. Current state of AD diagnostics using biomarkers. AD biomarkers are grouped and marked as it is proposed by Jack et al. [Citation6] as reflecting different sides of AD pathological process. A – biomarkers related to Aβ pathology (CSF Aβ42, CSF Aβ42/Aβ40 ratio and Aβ plaques measured by PiB-PET); T – biomarkers related to tau pathology (CSF P-tau and tau tangles measured my PET); (n) – biomarkers of neurodegeneration (synaptic dysfunction measured by FGD-PET, CSF T-tau and brain structure analysed by MRI); (c) – cognitive symptoms (mild cognitive impairment at prodromal stage and clinical dysfunction at dementia). Similar to (N), (C) can have a background other than AD and thus placed in parentheses. Despite cognitive syndromes are the consequences of neurodegeneration, (C) is placed on the top of this scheme as nowadays AD diagnostics begins from the recognition of cognitive changes, when the patient is suspected to be already in the prodromal stage of the disease. Further analysis of core AD biomarkers from A and T blocks confirms or rejects the diagnosis, whereas (N) biomarkers level help to estimate the degree of degenerative processes in CNS](/cms/asset/e17dbcaa-dd55-4d5d-892d-f84c5f5cf6f1/kprn_a_1917289_f0001_oc.jpg)
Figure 2. The principle of Single Molecule Array (SiMoA). A – Blood plasma sample is mixed with the excess of magnetic microbeads (2.7 μm diameter) with capture antibodies and detection antibodies. The number of beads added to the blood plasma sample exceed the number of molecules of protein-of-interest and thus each single bead will carry either single or no immunocomplex; B – Single beads with or without immunocomplex are loaded into 50 femtoliter well (4.5 μm diameter, 3.25 μm depths) of array. Rissin et al. [Citation48] used 2-mm-wide array possessing 50,000 wells; C – Reporter enzyme substrate is added and the well is sealed with silicon gasket. Activity of single molecule of reporter enzyme in 50 fl volume is enough to generate fluorescence signal detectable by fluorescence microscopy; D – Fluorescence image of a section of the array after the signals from single molecules of reporter enzyme are generated
![Figure 2. The principle of Single Molecule Array (SiMoA). A – Blood plasma sample is mixed with the excess of magnetic microbeads (2.7 μm diameter) with capture antibodies and detection antibodies. The number of beads added to the blood plasma sample exceed the number of molecules of protein-of-interest and thus each single bead will carry either single or no immunocomplex; B – Single beads with or without immunocomplex are loaded into 50 femtoliter well (4.5 μm diameter, 3.25 μm depths) of array. Rissin et al. [Citation48] used 2-mm-wide array possessing 50,000 wells; C – Reporter enzyme substrate is added and the well is sealed with silicon gasket. Activity of single molecule of reporter enzyme in 50 fl volume is enough to generate fluorescence signal detectable by fluorescence microscopy; D – Fluorescence image of a section of the array after the signals from single molecules of reporter enzyme are generated](/cms/asset/79e02d7e-a4cc-4802-9143-ab85dd4e39b7/kprn_a_1917289_f0002_oc.jpg)
Figure 3. Principle of the ImmunoPrecipitation followed by Mass Spectrometry (IP-MS) technique. A – Stable isotope labelled (SIL) Aβ (MS reference) is added to the sample of blood plasma; B – Beads covered with Aβ-specific antibodies are added to the sample. C – Aβ and SIL-amyloid-β are bind by the beads. D – Beads are washed to remove matrix protein of blood plasma sample. E – Elution of Aβ and SIL-amyloid-β from the beads for further MS analysis
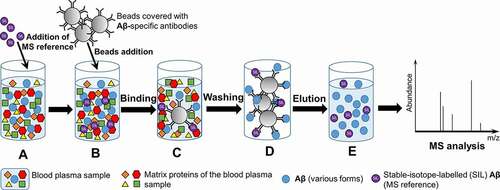
Figure 4. The principle of protein misfolding amplification techniques (PMCA and RT-QuIC). Biological sample, potentially containing protein polymers is added to the excess soluble monomeric protein. During incubation, polymers are growing by incorporating monomers. Repetitive rounds of sonication (in case of PMCA) or vigorous shaking (in case of RT-QuIC) are applied in order to fragment fibrils into oligomeric seeds. After several cycles of amplification, sufficient amount of polymeric protein is produced for detection by ELISA, polymer fractionation followed by immunoblotting, or by binding to amyloid-specific dyes such as ThT
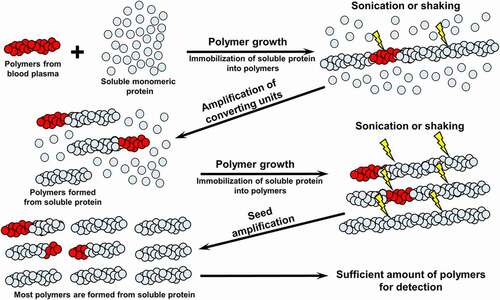
Figure 5. Detection of Aβ oligomers in blood plasma. This protocol consists of two sequential steps: 1) amplification of Aβ oligomers by ‘spiking’ of synthetic Aβ42 monomers into a blood plasma sample, followed by incubation for 48 h; 2) application of the Multimer Detection System [Citation75], an approach allowing to eliminate the signal from monomeric Aβ, thus detecting only Aβ oligomers. For this purpose, different capturing and detection antibodies recognizing overlapped epitopes of Aβ are used. A – Aβ monomers are captured by an antibody attached to the surface of the ELISA plate. Detection antibody cannot bind Aβ monomers, because the single epitope is already occupied by capturing antibodies. No signal can be produced and detected when HRP substrate is added. B – Both Aβ monomers and oligomers are captured by an antibody attached to the surface of the ELISA plate. Unlike monomers, oligomers can bind detection antibodies because they possess numerous epitopes, of which some are not occupied by the capturing antibody. Thus the signal can be produced and detected when HRP substrate is added
![Figure 5. Detection of Aβ oligomers in blood plasma. This protocol consists of two sequential steps: 1) amplification of Aβ oligomers by ‘spiking’ of synthetic Aβ42 monomers into a blood plasma sample, followed by incubation for 48 h; 2) application of the Multimer Detection System [Citation75], an approach allowing to eliminate the signal from monomeric Aβ, thus detecting only Aβ oligomers. For this purpose, different capturing and detection antibodies recognizing overlapped epitopes of Aβ are used. A – Aβ monomers are captured by an antibody attached to the surface of the ELISA plate. Detection antibody cannot bind Aβ monomers, because the single epitope is already occupied by capturing antibodies. No signal can be produced and detected when HRP substrate is added. B – Both Aβ monomers and oligomers are captured by an antibody attached to the surface of the ELISA plate. Unlike monomers, oligomers can bind detection antibodies because they possess numerous epitopes, of which some are not occupied by the capturing antibody. Thus the signal can be produced and detected when HRP substrate is added](/cms/asset/1439f06b-ddff-45a6-8aed-7cbe354ddd23/kprn_a_1917289_f0005_oc.jpg)
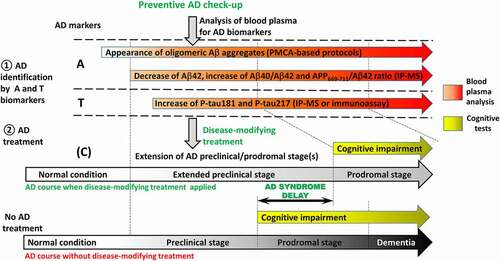
Figure 6. Prospective applications of blood plasma for early diagnostics of AD. Blood sampling is non-invasive procedure that is suitable for the implementation into preventive check-up for early identification of AD. Analysis of biomarkers specific for AD pathology (A and T blocks) gives a chance to identify AD at preclinical stage when patients are cognitively unimpaired. Application of disease-modifying treatment would allow to extend preclinical stage of disease and delay the development of AD syndrome and dementia