Figures & data
Table 1. List of taqman probes used in gene expression studies
Figure 1. Expression levels, as revealed by qPCR, of genes coding for specific proteins of astrocytes (a) and oligodendrocytes (b) in the cerebrum of tg340 control and tg340 sCJD MM1-inoculated mice at 0, 60, 120 (preclinical), and 180 (clinical stage) days post-inoculation (dpi). A significant increase in the expression of gfap and aqu4 is found at 160 and 180 dpi, whereas levels of mpc1, coding for mitochondrial pyruvate carrier 1, at 180 dpi, and mct4 and slc1a2, coding for monocarboxylic acid transporter member 4, and glial high affinity glutamate transporter, respectively, were significantly increased at 160 dpi with a trend not reaching statistical significance at 180 dpi. In contrast, expression levels of olig1, cspg4 (coding for NG2), plp1, mbp, and mog (coding for proteolipid protein 1, myelin basic protein, and myelin oligodendrocyte glycoprotein, respectively), did not show modifications up to 180 dpi. The levels of mct1 (coding for monocarboxylic acid transporter 1) were not affected. Only myrf was significantly increased at 180 dpi. Differences are considered statistically significant at * p < 0.05, ** p < 0.01, *** p < 0.001
Figure 2. Morphology and immunohistochemistry of the striatum in tg340 control and tg340 sCJD MM1-inoculated mice at 0, 60, 120 (preclinical), and 180 (clinical stage) days post-inoculation (dpi). A few vacuoles consistent with spongiform change are first seen in haematoxylin and eosin (H&E) stained sections at 120 dpi, and their number increases at 180 dpi (a-d). This is accompanied by a moderate, non-significant increase, in the number of reactive astrocytes and microglia at 120 dpi, and with marked increase of GFAP-immunoreactive cells (e-h) and microglia (Iba1-positive cells) (i-l) at 180 dpi. The number of oligodendrocytes, as revealed with the Olig2 antibody, shows a trend to decrease in the intrastriatal fibres at 180 dpi (m-p). The immunoreactivity to proteolipid protein 1 (PLP1) is preserved at 180 dpi (q-t). Nevertheless, some intrastriatal fascicles show focal, cotton-like decrease of myelin basic protein (MBP) immunoreactivity at the same time-point (u-y). These alterations occur in parallel with the presence of PrPres immunoreactivity. A few punctate PrPres deposits are seen at 120 dpi; a diffuse synaptic-like PrPRes immunostaining are found at 180dpi (z). Paraffin sections lightly counterstained with haematoxylin, A-P, bar = 25 μm; Q-Y, bar = 100 μm; Z, bar = 25 μm
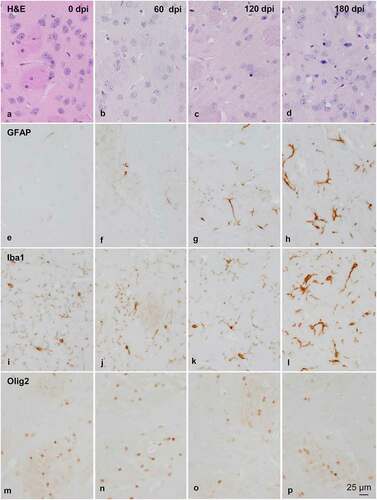
Figure 2. Continued
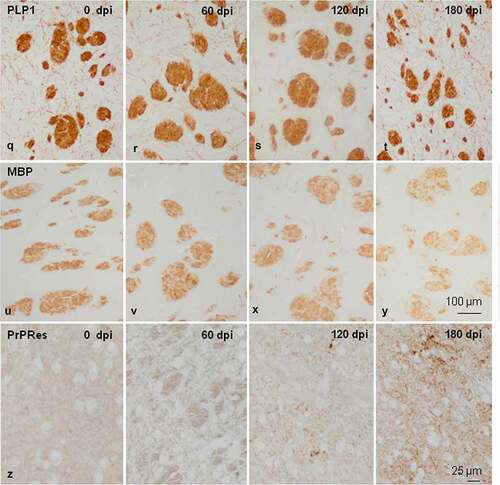
Figure 3. Quantification of GFAP-, Iba1- and Olig2-immunoreactive cells, and MBP densitometry (arbitrary units) per area at different dpi. Differences between inoculated groups at different incubation times are set at **p < 0.01, ***p < 0.001 vs. 0 dpi; ## p < 0.01, ### p < 0.001 vs. 60 dpi; and $ p < 0.05, $$$ p < 0.001 vs. 120 dpi