
Figures & data
Figure 1. Hepcidin is upregulated in scrapie infected mouse brains. (a) Control and scrapie infected mouse brains harvested at end-stage disease were treated with proteinase K (50 and 100 μg/ml) and analysed using WB. Probing for PrP (8H4) reveals complete digestion of control brain tissues with PK (lanes 1–3), while faster migrating PK-resistant bands are detected in PrPSc-infected tissue (lanes 4–6). (b) Amplification of hepcidin by RT-qPCR from scrapie infected mouse brains shows 2.6-fold upregulation relative to controls. GAPDH was used as a house-keeping gene. (c) Western blotting of mouse brain homogenates and probing for Fpn shows decreased expression in scrapie-infected samples relative to controls (lanes 3, 4 vs. 1, 2). (d) Densitometry after normalization with β-actin shows a significant decrease in Fpn expression in diseased brains relative to controls. (e) Western blotting and probing of the same samples for ferritin shows increased expression in scrapie-infected samples relative to controls (lane 3, 4 vs. 1, 2). (f) Densitometry after normalization with β-actin indicates significant upregulation of ferritin in scrapie-infected brain tissues relative to controls. A representative blot is shown in A, C, and E. Values are mean ± SEM of the indicated n. *p < 0.05, **p < 0.01, ***p < 0.001
Figure 2. Hepcidin is upregulated in autopsy brains from sCJD cases. (a) Amplification of hepcidin by RT-qPCR shows 1.7-fold upregulation relative to controls. GAPDH was used as a house-keeping gene. (b) Western blotting of brain lysates from sCJD and dementia samples and probing for hepcidin showed an increase in pro-hepcidin expression in sCJD samples relative to dementia controls (lanes 5–9 vs. 1–4). (c) Densitometry after normalization with β-actin revealed an upward trend in sCJD samples. (d) Western blotting of fresh samples from the same lysates and probing for Fpn showed decreased expression in sCJD samples relative to dementia controls (lanes 5–8 vs. 1–4). Re-probing of the same membrane for ferritin showed increased expression in sCJD samples relative to dementia controls (lanes 5–8 vs. 1–4). (E & F) Quantification of band intensity after normalization with β-actin showed a decrease in Fpn, and an increase in ferritin expression. Values are mean ± SEM of the indicated n. *p<0.05
Figure 3. Mini-hepcidin increases iron-mediated ROS and is toxic to M17 cells: (a) M17 cells cultured on cover-slips were exposed to vehicle or 50 µm PR73 for 16 h, and immunostained for Fpn. Vehicle-exposed cells show normal distribution of Fpn on the plasma membrane (panel 1), and internalization and degradation by PR73 (panel 2). Control cells immunoreacted with isotype-specific antibody show no reaction (panels 3 & 4). Scale bar: 25 µm. (b) Western blotting of M17 lysates exposed to vehicle of PR73 as above show downregulation of Fpn by PR73 (lane 2 vs. 1). Re-probing of the same membrane for ferritin shows upregulation in cells exposed to PR73 (lane 2 vs. 1). A representative blot is shown. (c) Densitometry after normalization with β-actin confirms significant down regulation of Fpn and upregulation of ferritin relative to controls. Values are mean ± SEM of the indicated n. *p < 0.05, ***p < 0.001. (d) Increase in intracellular ROS in M17 cells exposed to increasing concentrations of PR73 was quantified by estimating the change in fluorescence intensity of DHE-loaded cells relative to cells exposed vehicle (0%) or 250 µM of H2O2 (44%) in complete medium. Exposure to 25 µM PR73 increased the fluorescent intensity to 11%, with a further increase to 20% by 50 and 75 µM PR73, and 44% with 250 µM H2O2. (e) Release of LDH in the medium as a measure of cytotoxicity revealed 3% with 25 µm PR73, increasing to 21% with 50 and 75 µm PR73 relative to vehicle exposed cells at 0%, and Triton X-100 exposed cells at 100%. Values represent three independent estimations of triplicate cultures. *p < 0.05, **p < 0.01, ***p < 0.001
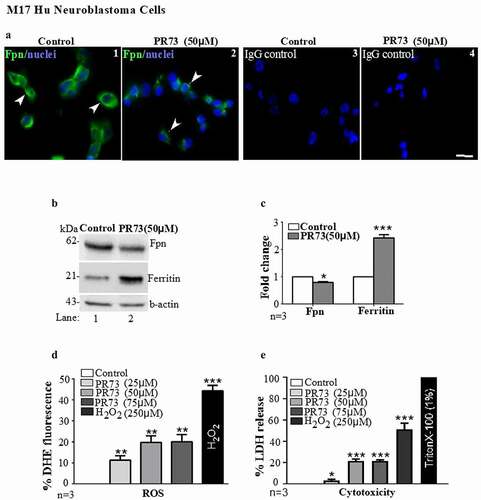
Figure 4. Mini-hepcidin increases iron-mediated ROS and is toxic to primary mouse neurons. (a) Mouse brain primary neurons cultured on cover-slips were reacted with NeuN, a neuron specific antibody. A clear reaction is detected in neuronal cell bodies and axons (panel 1). No reaction is detected with isotype specific antibody (panel 2). Scale bar: 25 µm. (b) Exposure of neuronal cultures to 10 µM of PR73 for 4 h results in strong reactivity for ferritin relative to vehicle treated cells (panel 2 vs. 1). No reaction is detected in cells immunostained with isotype-specific antibody (panel 3). (c) Primary neuronal cells exposed to vehicle or 10 µM of PR73 for 4 h followed by DHE show intense fluorescence in PR73 exposed cells, indicating generation of ROS (panel 2 vs. 1). (d) Nuclei of cells showing a positive reaction for ROS react with propidium iodide, indicating cytotoxicity. Scale bar: 25 µm
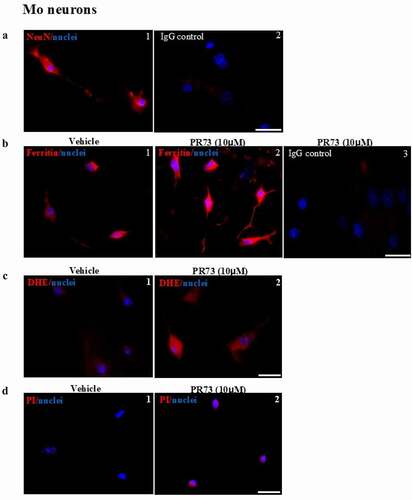
Table 1. Dementia and sCJD brain tissue
Table 2. List of antibodies used in the study