Figures & data
Table 1. Study animal location, ID, sex, and PrP genotypes in codon 132 (M. methionine; L. leucine) for CWD isolate evaluation
Table 2. Site 1 direct and indirect contact animals. group, ID, sex, incubation period (if applicable), CWD status at death, and PrP genotypes at codon 132 (M, methionine; L, leucine)
Figure 1. The fibril stability of PrPSc from the two sites are different. (a) Representative fibril stability curves for samples from sites 1 and 2. The connecting lines are presented to aid the eye and highlight the point at which each unfolding curve intersects a fraction fibril of 0.5. Both Site 1-A and Site 1-B samples exhibit visibly higher fibril stability than the Site 2 samples based upon the concentration of GdnHCl at which the fraction fibril reaches 0.5 (Cmid). (b) Bargraph of quantified Cmid values of the site 1 and site 2 samples. The average Cmid value of site 1 samples (2.53 ± 0.05 M) is significantly higher than that of site 2 samples (2.16 ± 0.09 M) (p = 0.0043)
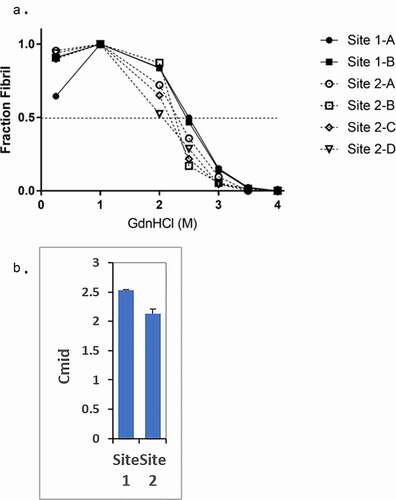
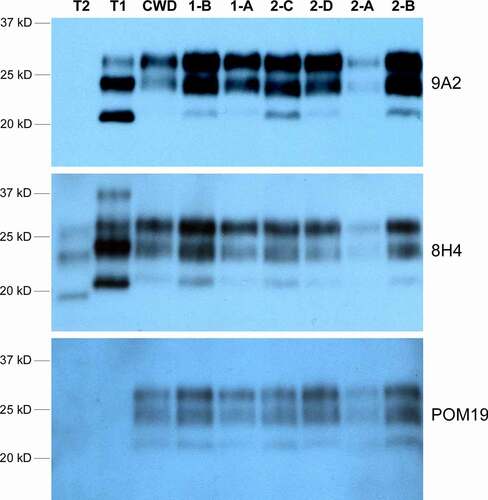
Figure 2. Western blot of CWD PrPRES in the brain tissues from Sites 1 and 2 elk. Four anti-PrP antibodies that target different PrP epitopes were used: 9A2 (epitope 97–115), 8H4 (epitope 177–180), and POM19 (epitope 201–225). POM19 does not recognize human PrP whereas 9A2 shows higher affinity for type 1 PrPRES. T1 and T2 are type 1 sCJD and type 2 sCJD human brain tissue controls, respectively. ‘CWD’ is a positive control elk CWD brain sample from an unrelated study. The loading amount was adjusted between the brain samples to allow more comparable signal strength for all samples with the same exposure: 5ul of 5% brain homogenate for 1-B, 1-A, 2-C and 2-A; 2ul of 5% brain homogenate for 2-D, 2-B and the control ‘CWD’ samples; 30ul of 5% brain homogenate for T1 and T2 human sCJD controls. The difference in sample loading volume was made up with 5% brain homogenate from PrPKO/FVB mice