Figures & data
Figure 1. Scent glands and non-integumentary tissues sampled from mule deer and white-tailed deer from Canadian forces base wainwright, Alberta.
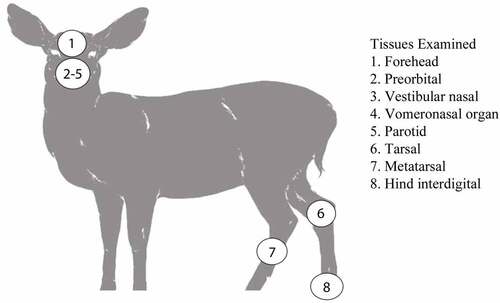
Figure 2. Relative pixel intensity analysis of PrPC expression in non-integumentary cranial exocrine clarified 10% (w/v) gland homogenates of mule deer (a, c) and white-tailed deer (b, d). Background-adjusted average pixel intensities of PrPC bands of the vomeronasal organs (a-b) and parotid glands (c-d) were compared between lanes of SDS-PAGE PVDF membranes probed with anti-PrP Sha31. Unclarified white-tailed deer whole brain homogenate was used for reference. Sample size, mean, 95% confidence intervals, and significance by Mann-Whitney tests are shown.
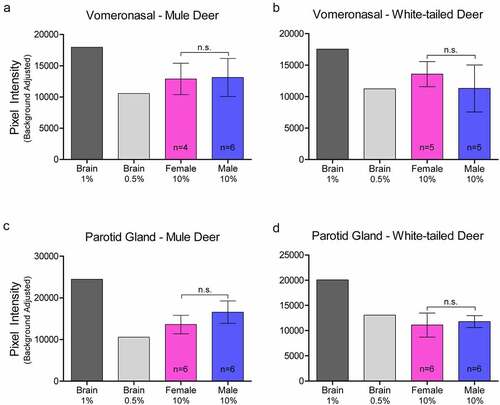
Figure 3. Relative pixel intensity analysis of PrPC expression in facial integumentary clarified 10% (w/v) gland homogenates of mule deer (A, C, E) and white-tailed deer (B, D, F). Background-adjusted average pixel intensities of PrPC bands of forehead (a-b), preorbital (c-d), and vestibular nasal glands were compared between lanes of SDS-PAGE PVDF membranes probed with anti-PrP Sha31. Unclarified white-tailed deer whole brain homogenate was used for reference. Sample size, mean, 95% confidence intervals, and significance by Mann-Whitney tests are shown.
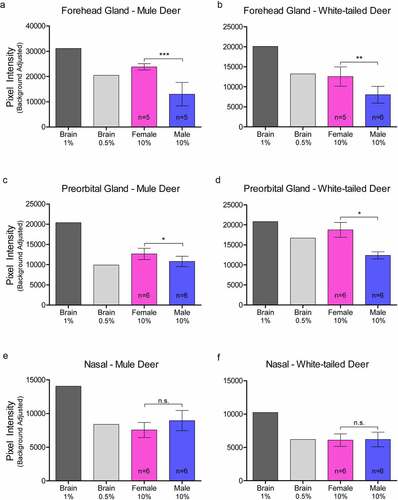
Figure 4. Relative pixel intensity analysis of PrPC expression in leg integumentary clarified 10% (w/v) gland homogenates of mule deer (A, C, D) and white-tailed deer (B, D, F). Background-adjusted average pixel intensities of PrPC bands of tarsal (a-b), metatarsal (c-d), and interdigital (e-f) glands were compared between lanes of SDS-PAGE PVDF membranes probed with anti-PrP Sha31. Unclarified white-tailed deer whole brain homogenate was used for reference. Sample size, mean, 95% confidence intervals, and significance by Mann-Whitney tests are shown.
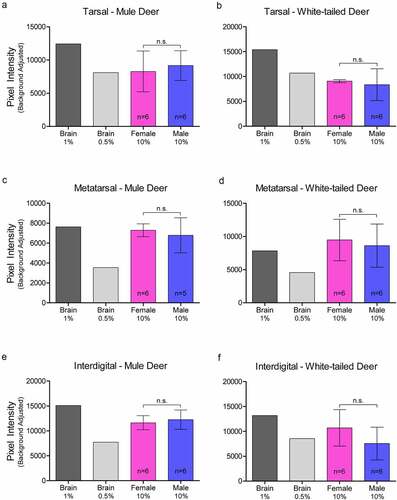
Figure 5. Protein concentration-adjusted PrPC protein expression in deer exocrine glands. Capillary electrophoresis immunoassay chemiluminescence sample size, mean, and 95% confidence intervals of clarified 10% (w/v) deer gland homogenates prepared in RIPA buffer. Deer facial (a-e) and leg (f-h) tissue and gland homogenate samples were adjusted to final protein concentrations of 1.5 μg/μL for the immunoassay. PrPC signal was detected by anti-PrP SHA31 antibody.
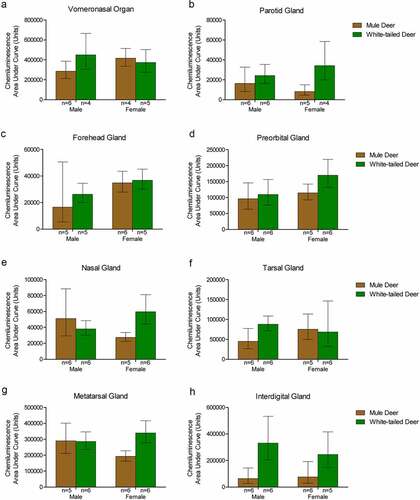
Table 1. Species and sex influence on PrPC detection by anti-PrP SHA31 capillary gel electrophoresis assay with total protein concentration-standardized 10% (w/v) clarified gland homogenates
Figure 6. Quantified PrPC protein concentration in deer gland homogenates. Total PrPC concentrations of individuals, means, and 95% confidence intervals of clarified 10% (w/v) mule deer (MD) and white-tailed deer (WT) facial (a-e) and leg (f-h) gland homogenates prepared in RIPA buffer as determined by SHA31-N5 sandwich ELISA. Protein concentration was calculated using a full-length recombinant deer prion protein standard curve.
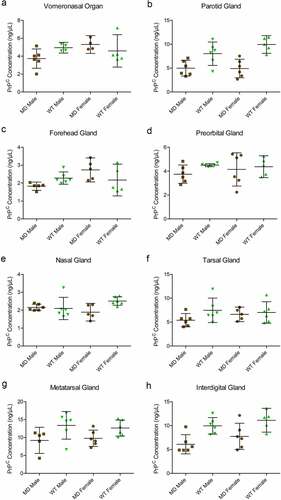
Table 2. Mean PrPC concentrations and 95% confidence intervals of clarified 10% (w/v) gland homogenates as determined by SHA31-N5 sandwich ELISA
Figure 7. Tissue structure PrPC distribution in mule deer and white-tailed deer exocrine glands. Anti-PrP BAR224 immunohistochemistry is contrasted with haematoxylin counterstain. BAR224 and no-primary antibody control immunohistochemistry slides of each gland were developed in the same batches. Scale bars for tarsal glands: 500 µm. All other scale bars: 250 µm.
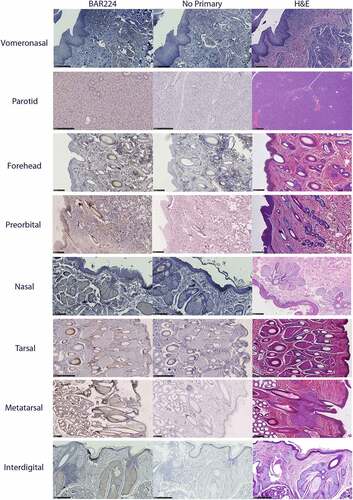
Figure 8. PrPC distribution within non-integumentary facial glands. Immunohistochemical BAR224 detection of PrPC (brown) with haematoxylin counterstaining. Female mule deer A) vomeronasal organ, and B) parotid gland. Structure abbreviations: SA, serous acini; SD, striated duct; SM, submucosa; VL, vomeronasal lumen; VRE, vomeronasal respiratory epithelium; VTS, vomeronasal tubular serous glands.
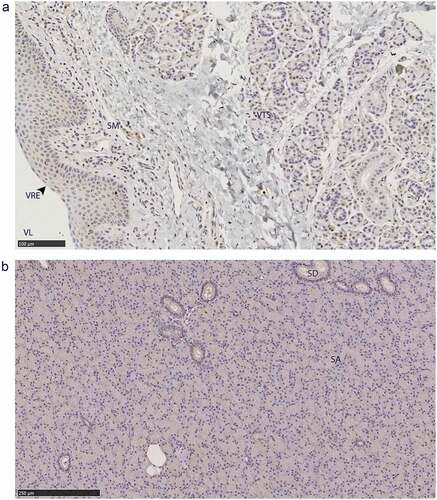
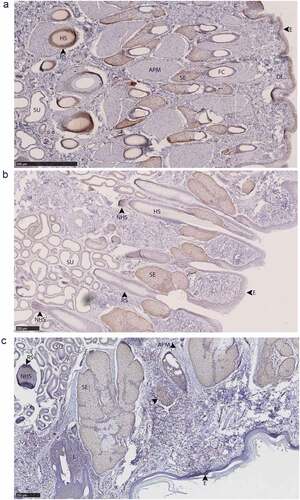
Figure 9. PrPC distribution within facial integumentary glands. Immunohistochemical BAR224 detection of PrPC (brown) with haematoxylin counterstaining. White-tailed male deer A) forehead gland, B) preorbital gland with magnified inset of infiltrating leukocytes, and mule deer female C) lateral vestibular nasal gland. Structure abbreviations: E, epidermis; FC, follicular canal; HS, hair shaft; L, leukocytic infiltrates; M, skeletal muscle; RS, follicular root sheath; SE, sebaceous glands; and SU, sudoriferous glands.
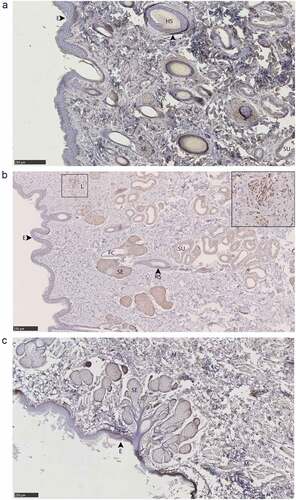
Figure 10. PrPC distribution within leg integumentary glands. Immunohistochemical BAR224 detection of PrPC (brown) with haematoxylin counterstaining. White-tailed male deer A) tarsal gland, B) metatarsal gland, and mule deer female C) interdigital gland. Structure abbreviations: APM, arrector pili muscle; DE, dermis elastic layer; E, epidermis; FC, follicular canal; HS, hair shaft; L, leukocytic infiltrates; NHS, nucleated region of the hair shaft; RS, follicular root sheath; SE, sebaceous glands; and SU, sudoriferous glands.