Figures & data
Table 1. Haplotypes inferred based on the two polymorphic sites found in our study of elk from the state of Pennsylvania, U.S.A., and those reported by Chafin et al. [Citation47] for white-tailed deer. For comparison purposes, we only show their results for two polymorphic sites: one (nucleotide 60) in a position similar to the one we found and the other (nucleotide 286) linked to differential CWD-susceptibility in white-tailed deer (similar to nucleotide 394 in elk PRNP sequence).
Table 2. Frequencies of the different PRNP genotypes based on polymorphism at nucleotide 394 in our study, and those reported for other elk populations. N = number of individuals, % = percentage in our sample, JN% = percentage calculated from a sample of 55 individuals from Wyoming [Citation11], BH% = percentage calculated from a sample of 42 individuals from South Dakota [Citation11], WIND% = percentage calculated from a sample of 186 individuals from Wyoming [Citation10], ABSA% = percentage calculated from a sample of 148 individuals from Wyoming [Citation10], THRO% = percentage calculated from a sample of 199 individuals from North Dakota [Citation10], PA% = percentage found in our dataset based on a bootstrapping procedure, adjusting sample size to match the ones obtained in previous studies for different populations.
Figure 1. a) Distribution of elk samples (circles) collected in Pennsylvania’s Elk Management Area (EMA, current delineation shown) between 2014 and 2020 (n = 565). Disease Management Area 3 (DMA3, cross-hatched) is adjacent to EMA, while Disease Management Area 6 (DMA6, hatched) is inside EMA. b) Distribution of elk samples (circles) as shown in Figure 2a, and hunt zone delineation used in the period 2018–2020, for which we estimated the proportions of less susceptible genotypes. These hunt zones are located within the Elk Management Area. Two hunt zones were created during our sampling period: zone 13 (incorporated in 2015) and zone 14 (incorporated in 2018).
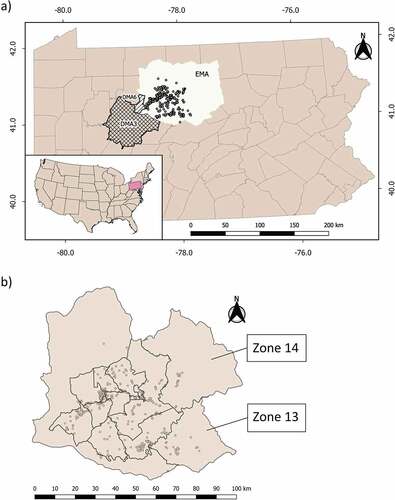
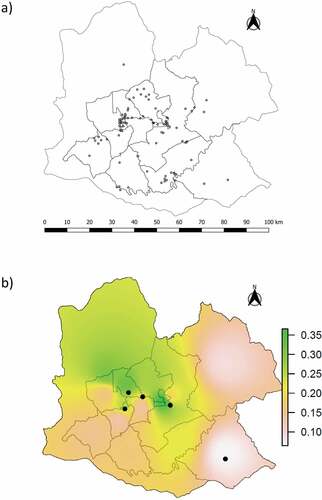
Figure 2. Distribution of less susceptible PRNP genotypes (Met/Leu and Leu/Leu) obtained from our sample of 565 elk, shown as: (a) presence of the 109 less susceptible genotypes using individual GPS coordinates, and (b) interpolation based on the proportion of Met/Leu individuals in each hunt zone, with circles representing Leu/Leu individuals. The interpolation combining both types of less susceptible genotypes showed the same pattern.