
Figures & data
Figure 1. An image of the 8-port scent wheel used for the wheel detection study.
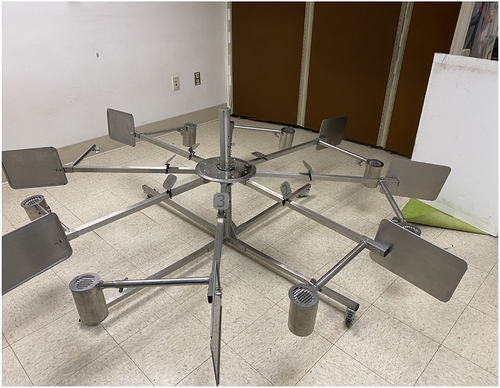
Table 1. Participant information. This table shows information about the three dogs that participated in this study, including age, sex, prior trained odours, and the experience of the handler in doing field search work.
Figure 2. Example Mason jars with a restricted odour negative lid (left) and a mesh positive lid (right).
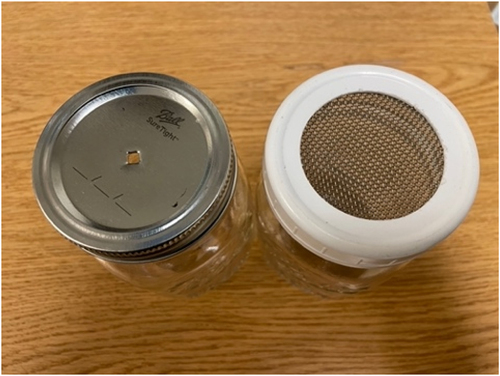
Figure 3. A diagram of the progress of field search stages in CWD. Line: an open, flat grassy field, with Mason jars covered with mesh lids set 2 yards apart in a straight line. Offset Line: jars were set in an offset line 2 yards apart. Tall Grass + Offset Line: jars in an offset line 4 yards apart in tall grass and weeds. Area: jars were randomly buried in a 10-yard by 20-yard field with only the lid visible.
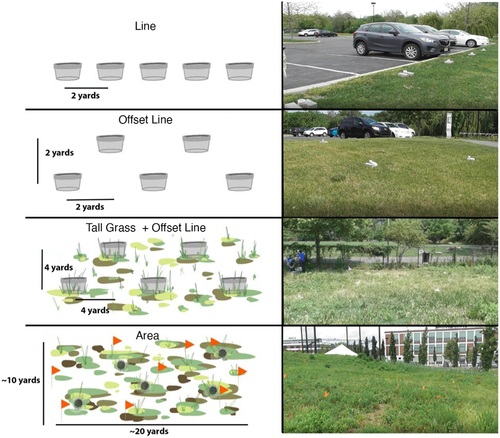
Figure 4. Diagram of the CWD field testing areas for Jari and Charlie.
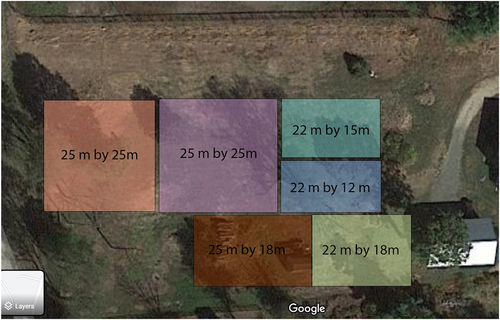
Table 2. Odour differentiation testing sensitivity and specificity. This table shows the in-lab sensitivity (correctly alerted-on positives over total positives) and specificity (correctly passed negatives over total negatives) for the three dogs in this study.
Table 3. Field detection experiment testing data. This table shows the field sensitivity (correctly alerted-on positives over total positives) and false alerts (falsely alerted-on negatives over total negatives) for the three dogs in this study. False alerts were used because it was difficult to determine if a dog sniffed and passed a sample (true negative) or did not sniff the sample at all and passed it due to field search mechanics issues.