
Figures & data
Figure 1. Root mean square inner product (rmsip) between all normal modes of any two conformers. A rmsip value greater than 0.6 indicates similarity of the deformation modes.
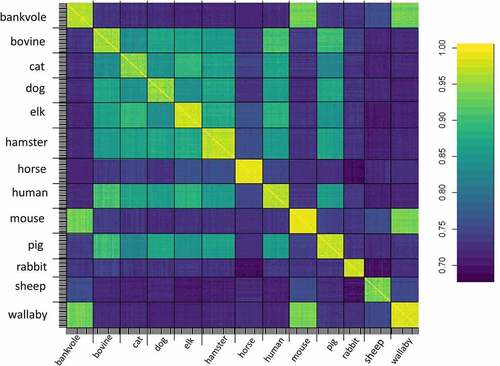
Figure 2. The top bar indicates secondary structure elements of the C-terminus of PrPC: three α-helices and two short β-sheets. Figure 2a shows the root mean square fluctuation of each residue. Figure 2b shows the betweenness centrality of each residue. Figure 2c shows the eigenvector centrality of each residue. In all cases, residue numbering is according to human PrPC.
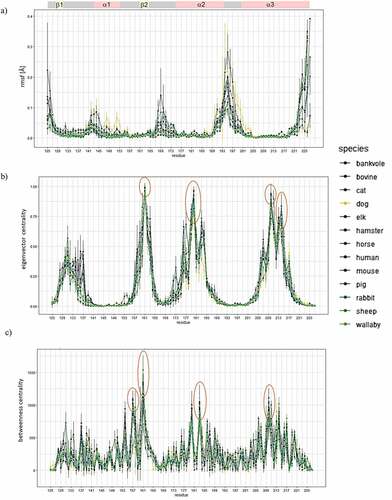
Figure 3. Figure 3a shows the two main subdomains identified with the GeoStaS algorithm; each subdomain is displayed with different colour. Figure 3b shows the main correlated couplings (lines in pink colour). Figure 3c shows the main anticorrelated couplings (lines in green colour). The ribbon illustration corresponds to human PrPC.
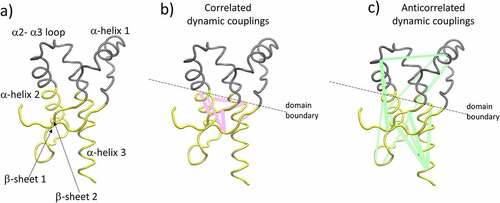
Figure 4. Dynamic cross correlation matrix averaged over the NMR ensemble of human PrPC. Figure 4a illustrates residues with strong correlated motion. Figure 4b illustrates residues with strong anticorrelated motion. Figure 4c and Figure 4d use the same molecular representation to highlight dashed-line ovals in-phase deformations (figure 4c) and out-of-phase deformations (figure 4d). In all cases arrows point at the matrix region that illustrates the coupling between the sets of residues.
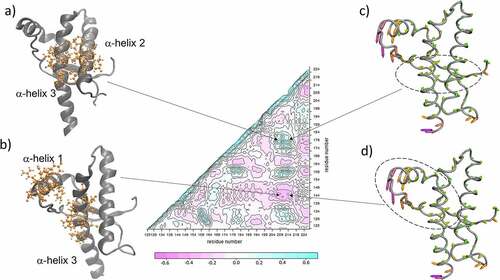
Table 1. List of peaks that represent strongest couplings observed in the dynamical cross correlation matrix of each NMR ensemble. Two protein sites were considered to be short distance if at least one pair of Cα-atoms from each site is within 8Å.
Table 2. Residues that exhibit largest betweenness and eigenvector centrality z-score. A z-score greater than 2 means that the value is more than two standards deviations away from the mean. A locality factor = 5 Å filters out long-range effects by dampening the strength of the dynamic coupling between distant residues.
Figure 5. Distal but coupled residues that form the structure core of the protein structure. Molecular representation shown on the globular C-terminus of human PrPC.
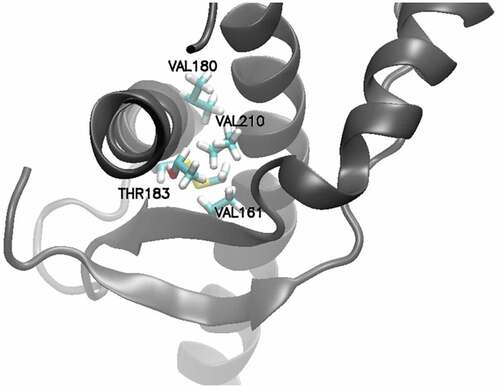
Figure 6. Binding poses of PPS on hamster PrPC and dynamic cross correlation matrix averaged over the NMR ensemble of hamster PrPC. Arrows point at the matrix position that illustrates the coupling between the two protein sites to which PPS binds.
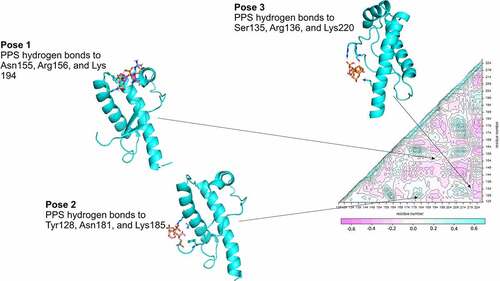
Table 3. Binding poses of the pharmacological chaperone PPS on the C-terminus of PrPC. All binding poses correspond to PPS binding to two sites on the protein. The residues that form hydrogen bonds with PPS are highly conserved across the species analysed.